Warehouse Details
The Warehouse Details view provides a deep, warehouse-specific breakdown of compute consumption, workload activity, and configuration for a single Snowflake warehouse.
It allows FinOps and data platform teams to analyze how a warehouse behaves over time, understand its cost drivers, and identify opportunities for optimization or right-sizing.
This view is used when a warehouse has been identified as cost-heavy, underutilized, or operationally important, and a deeper investigation is needed.
Warehouse Summary
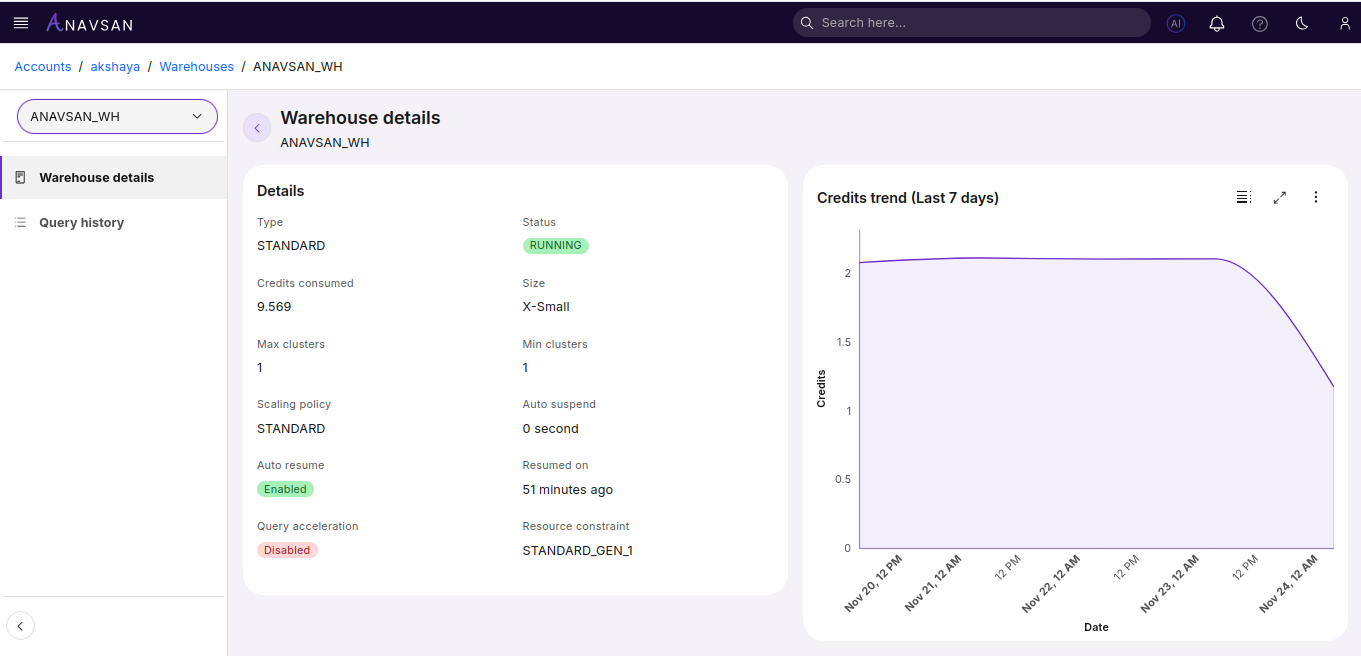
A high-level summary card presents the key usage and configuration information for the selected warehouse:
- Warehouse Name & Size – Identifies the warehouse and its compute capacity tier (e.g., X-Small, Medium, Large).
- Total Credits Used – Total compute credits consumed within the selected date range.
- Executed Queries – Number of queries processed by the warehouse.
- Running Time – Total active time of the warehouse, helping assess utilization efficiency.
- Last Active – The most recent query execution or resume event.
These metrics provide immediate insight into workload intensity, credit burn, and overall operational footprint.
Credit Consumption Trend
A line or area chart shows how credits were consumed over time.
Insights Provided
- Identify cost spikes or anomalies
- Detect peak workload periods
- Compare daily or hourly patterns
- Correlate credit usage with warehouse size changes or resume events
This view helps teams understand when and why the warehouse consumes the most credits.
Warehouse Configuration
This section displays the full configuration of the warehouse:
- Warehouse Size
- Warehouse Type (Standard, Snowpark-optimized, etc.)
- Auto-Suspend Timeout
- Auto-Resume Setting
- Multi-Cluster Settings (min/max clusters, scaling policy)
- Current Status (Running or Suspended)
Understanding configuration is critical for diagnosing cost scaling, concurrency behavior, and idle-time credit usage.
Recommendations & Observations
Based on the warehouse’s actual usage patterns and configuration, this section may highlight:
Right-Sizing Opportunities
If the warehouse size is larger than workload demands.
Auto-Suspend Improvements
When idle time is high or warehouses remain running unnecessarily.
These insights help teams take action to optimize cost and performance directly from the warehouse analysis.
Navigation & Interaction
Users can:
- Adjust the date range to analyze short-term or long-term trends
- Move back to All Warehouses for overview comparison
- Export usage metrics for governance or reporting
This creates a seamless workflow from account-level FinOps visibility to detailed warehouse-level diagnostics.