Warehouse Overview
The Warehouse Overview dashboard provides a consolidated view of compute usage across all Snowflake warehouses within a single account. It is designed for FinOps practitioners, data platform engineers, and Snowflake administrators who need rapid visibility into cost drivers, usage patterns, and optimization opportunities at the warehouse layer.
This dashboard serves as the first point of analysis to understand where compute spend is concentrated and how effectively warehouses are configured and utilized.
Warehouse Summary
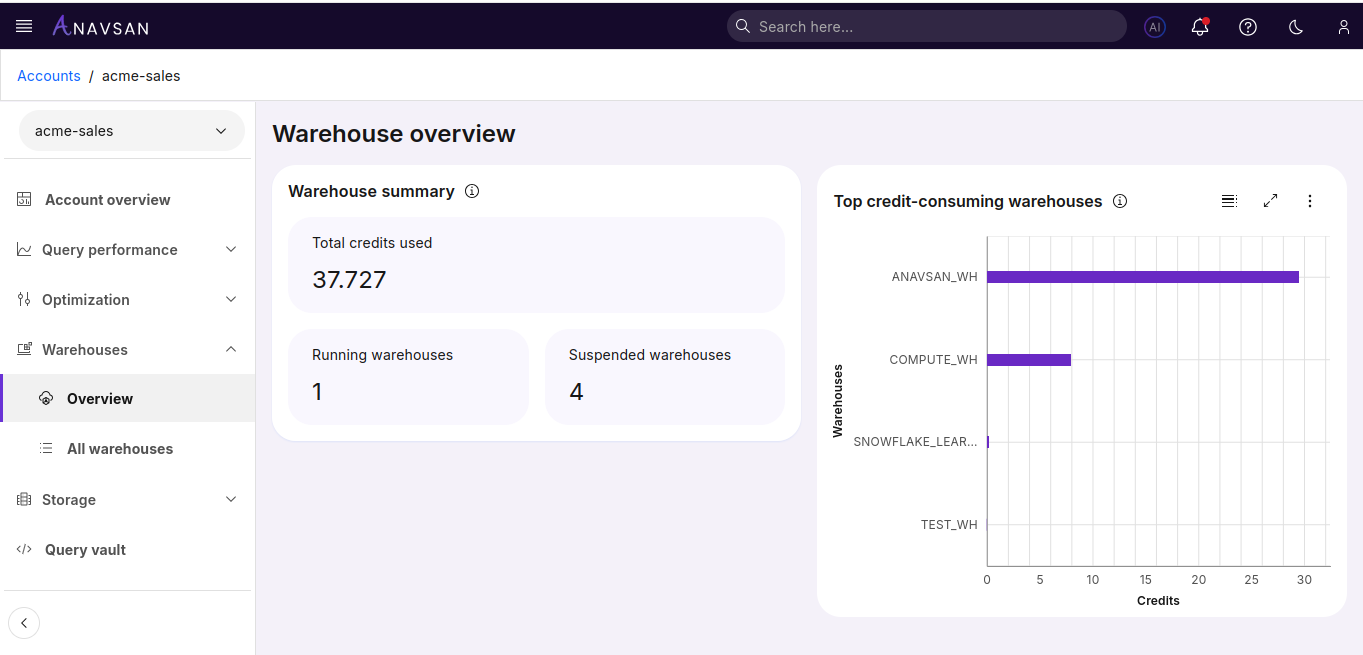
The Warehouse Summary offers a high-level snapshot of warehouse activity and compute consumption for the selected date range.
Metrics Included
Total Credits Used
The total compute credits consumed by all warehouses. This represents the primary driver of Snowflake compute cost.
Running Warehouses
The number of warehouses currently in an active state. A high count may indicate parallel workloads or potential oversizing.
Suspended Warehouses
The number of warehouses currently in a suspended state. Monitoring this helps validate whether auto-suspend settings are effectively reducing idle consumption.
Why It Matters
This summary helps teams quickly assess:
Whether compute usage is balanced across warehouses
If idle warehouses are being suspended appropriately
Where to focus cost-optimization efforts (e.g., consolidating warehouses, tuning auto-suspend, or right-sizing)
Top Credit-Consuming Warehouses
This horizontal bar chart highlights which warehouses contribute most to Snowflake compute spend. It enables teams to immediately identify high-impact optimization targets.
Chart Details
X-axis: Credits consumed
Y-axis: Warehouse name
Ordering: Highest to lowest credit consumption
Bars: Longer bars represent higher usage
Usage & Navigation
Users can click on any bar or warehouse label to open the Warehouse Detail View, which includes deeper insights. This makes it easy to drill down from high-level cost drivers into actionable diagnostics.
How FinOps Teams Use This Data
The Warehouse Overview supports multiple FinOps and DataOps workflows:
Cost Attribution: Identify which warehouses — and therefore which teams or workloads — drive compute spend.
Optimization Prioritization: Focus on the top 10–20% of warehouses that typically generate 80% of costs.
Operational Monitoring: Detect unusual spikes or new warehouses that consume disproportionate credits.