Data Cloud Overview
The Data Cloud Overview is the central hub for organizational visibility into Snowflake cost and resource consumption across all connected accounts. This page aggregates insights into credit usage, warehouse activity, and storage metrics, enabling FinOps teams to establish baseline spending patterns, identify cost drivers, and prioritize optimization efforts at the organization level.
Overview
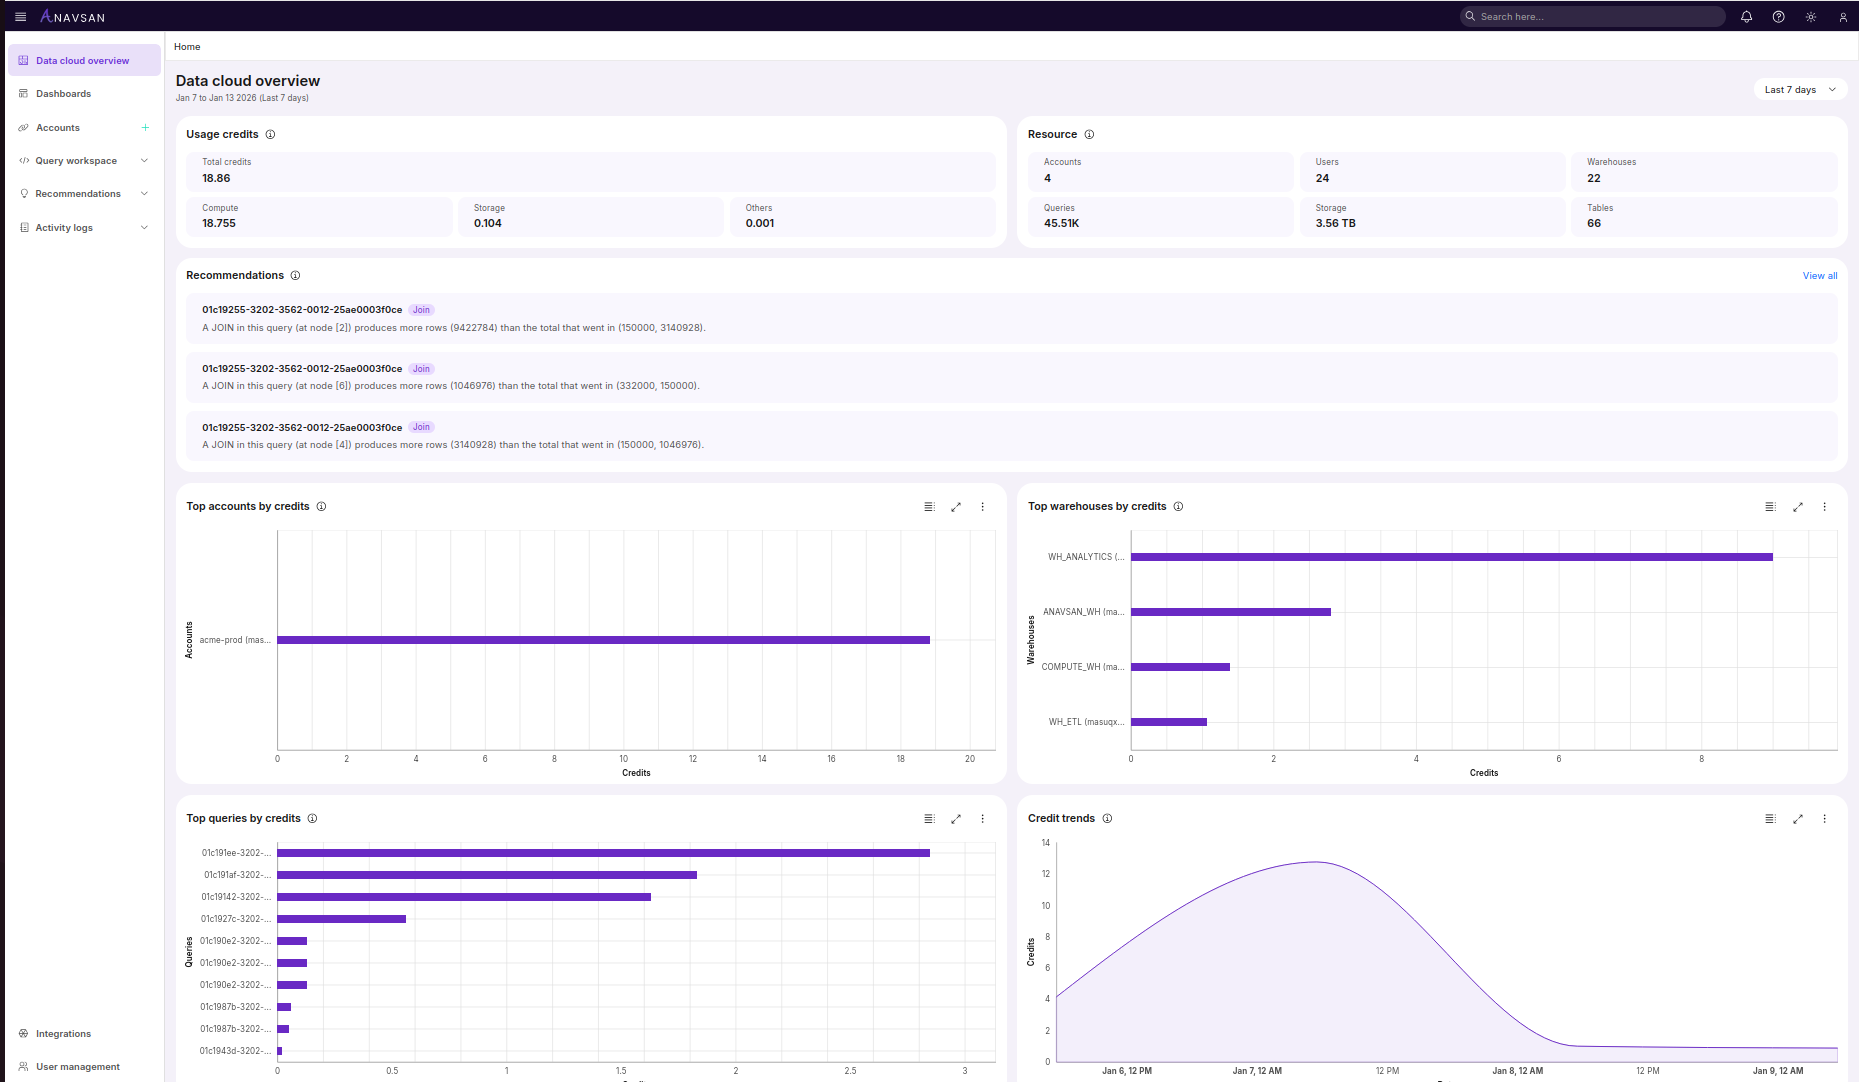
Once Snowflake accounts are connected, the Data Cloud Overview dashboard populates with metrics and visualizations.
Usage credits
This section displays the total Snowflake credits consumed during the selected time period with a detailed breakdown:
-
Total credits shows the aggregate credit consumption across all connected accounts for the selected date range.
-
Compute displays credits consumed by compute warehouses for query execution and processing.
-
Storage shows credits consumed by data storage, including tables, stages, and time travel.
-
Others represents credits consumed by additional services such as Snowpipe, materialized views, or replication.
This breakdown helps identify which resource type is driving your Snowflake costs.
Resource
A summary panel displaying key infrastructure metrics across all connected accounts:
-
Accounts shows the number of Snowflake accounts connected to Anavsan.
-
Users displays the total number of users across all connected accounts.
-
Warehouses shows the total number of compute warehouses being monitored.
-
Queries displays the number of queries executed during the selected time period.
-
Storage shows total Snowflake storage usage across all connected accounts.
-
Tables displays the total number of tables across all connected accounts.
These metrics provide a high-level view of your Snowflake infrastructure scale and activity.
Recommendations
Displays a list of query optimization recommendations based on automated analysis of your Snowflake usage patterns. These recommendations identify inefficient queries that may be consuming excessive credits or resources.
Click "View all" to see the complete list of query recommendations and take action on optimization opportunities.
Top accounts by credits
A horizontal bar chart that ranks connected Snowflake accounts by total credit consumption.
- Longer bars indicate higher credit consumption for a given account.
- Account names appear on the y-axis, credits appear on the x-axis.
- Accounts are ordered highest-to-lowest by cost.
- Clicking a bar or account label navigates to that account's Account Overview for - warehouse and query-level drill-down.
This view helps FinOps teams quickly identify which accounts should be targeted for cost investigation and optimization.
Top warehouses by credits
A horizontal bar chart displaying the warehouses with the highest credit consumption across all connected accounts.
- Shows warehouse names and their associated credit usage.
- Warehouses are ordered by consumption from highest to lowest.
- Clicking a bar or warehouse label navigates to that warehouse's detailed view within its account for query-level analysis.
This view helps FinOps teams quickly identify which warehouses should be targeted for optimization or right-sizing.
Top queries by credits
A horizontal bar chart ranking individual queries by their credit consumption.
- Displays query IDs with their corresponding credit usage.
- Ordered from highest to lowest consumption.
- Clicking a bar or query ID navigates to that query's detailed view for in-depth analysis and optimization.
This view helps FinOps teams quickly identify which queries should be targeted for optimization, caching, or restructuring.
Credit trends
A line chart showing credit consumption patterns over time during the selected period.
- The x-axis displays timestamps, the y-axis shows credit usage.
- Visualizes consumption trends, spikes, and patterns throughout the day or week.
- Helps identify peak usage times and unusual consumption patterns that may indicate issues or opportunities for optimization.
Common workflows
Investigate a spending spike:
- Check Top Credit-Consuming Accounts to locate the spike.
- Click the account to navigate to Account Overview.
- Review warehouse activity and identify the long running queries.
- Assign the query to the responsible data engineer for further investigation and optimization to cut down the credit consumption .