Account Overview
This page presents a consolidated view of usage and spend for a single Snowflake account, enabling FinOps users to monitor credit consumption, identify cost drivers, and prioritize optimization efforts.
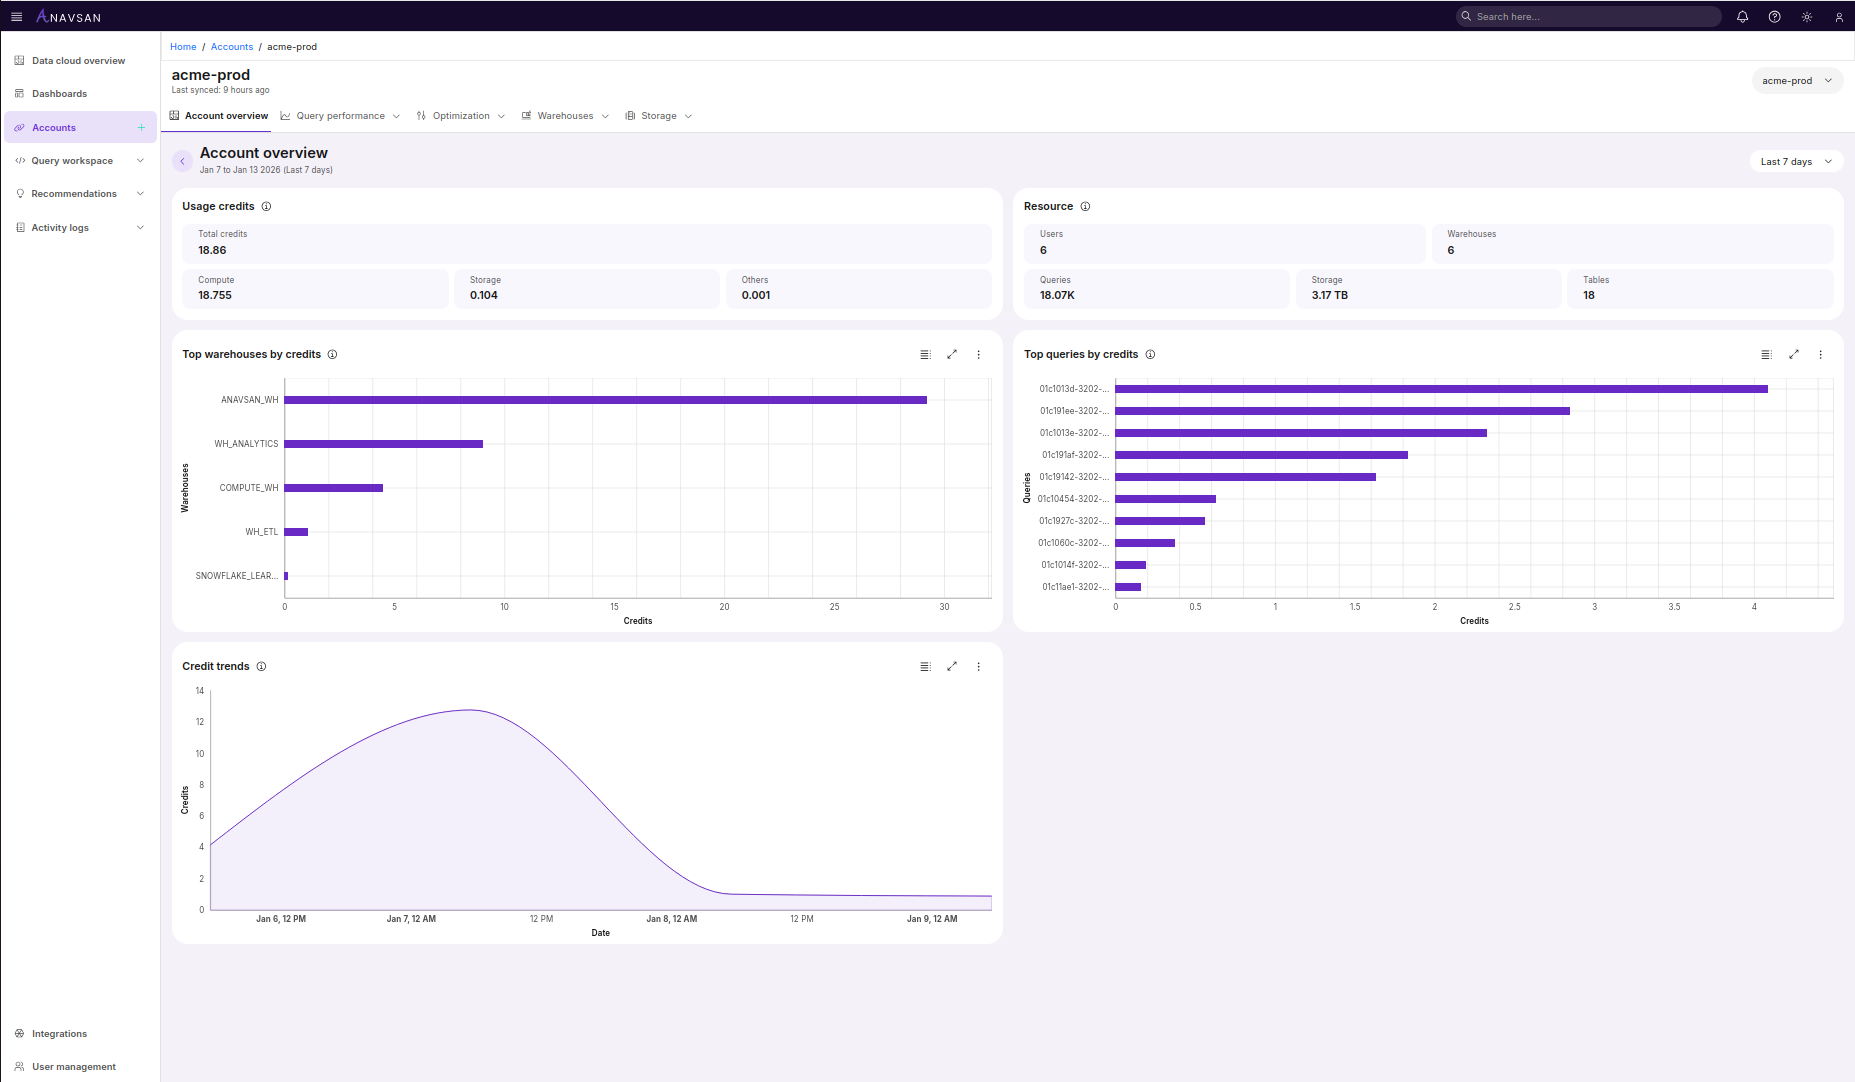
The Account Overview displays metrics for the selected account during the chosen time period.
Data Synchronization
Last synced - Displays the time elapsed since the last data synchronization from Snowflake (e.g., "6 hours ago"). This timestamp helps you understand data freshness and determine if metrics reflect recent activity.
Usage credits
This section displays the total Snowflake credits consumed during the selected time period with a detailed breakdown:
-
Total credits shows the aggregate credit consumption for the selected account during the date range.
-
Compute displays credits consumed by compute warehouses for query execution and processing.
-
Storage shows credits consumed by data storage, including tables, stages, and time travel.
-
Others represents credits consumed by additional services such as Snowpipe, materialized views, or replication.
This breakdown helps identify which resource type is driving your Snowflake costs for this account.
Resource
A summary panel displaying key infrastructure metrics for the selected account:
-
Users displays the total number of users in this account.
-
Warehouses shows the number of compute warehouses in this account.
-
Queries displays the number of queries executed during the selected time period.
-
Storage shows total Snowflake storage usage for this account.
-
Tables displays the total number of tables in this account.
These metrics provide a high-level view of the account's infrastructure scale and activity.
Top warehouses by credits
A horizontal bar chart displaying the warehouses with the highest credit consumption in this account.
- Shows warehouse names and their associated credit usage.
- Warehouses are ordered by consumption from highest to lowest.
- Clicking a bar or warehouse label navigates to that warehouse's detailed view for query-level analysis.
This view helps FinOps teams quickly identify which warehouses should be targeted for optimization or right-sizing.
Top queries by credits
A horizontal bar chart ranking individual queries by their credit consumption in this account.
- Displays query IDs with their corresponding credit usage.
- Ordered from highest to lowest consumption.
- Clicking a bar or query ID navigates to that query's detailed view for in-depth analysis and optimization.
This view helps FinOps teams quickly identify which queries should be targeted for optimization, caching, or restructuring.
Credit trends
A line chart showing credit consumption patterns over time during the selected period.
- The x-axis displays timestamps, the y-axis shows credit usage.
- Visualizes consumption trends, spikes, and patterns throughout the day or week.
- Helps identify peak usage times and unusual consumption patterns that may indicate issues or opportunities for optimization.