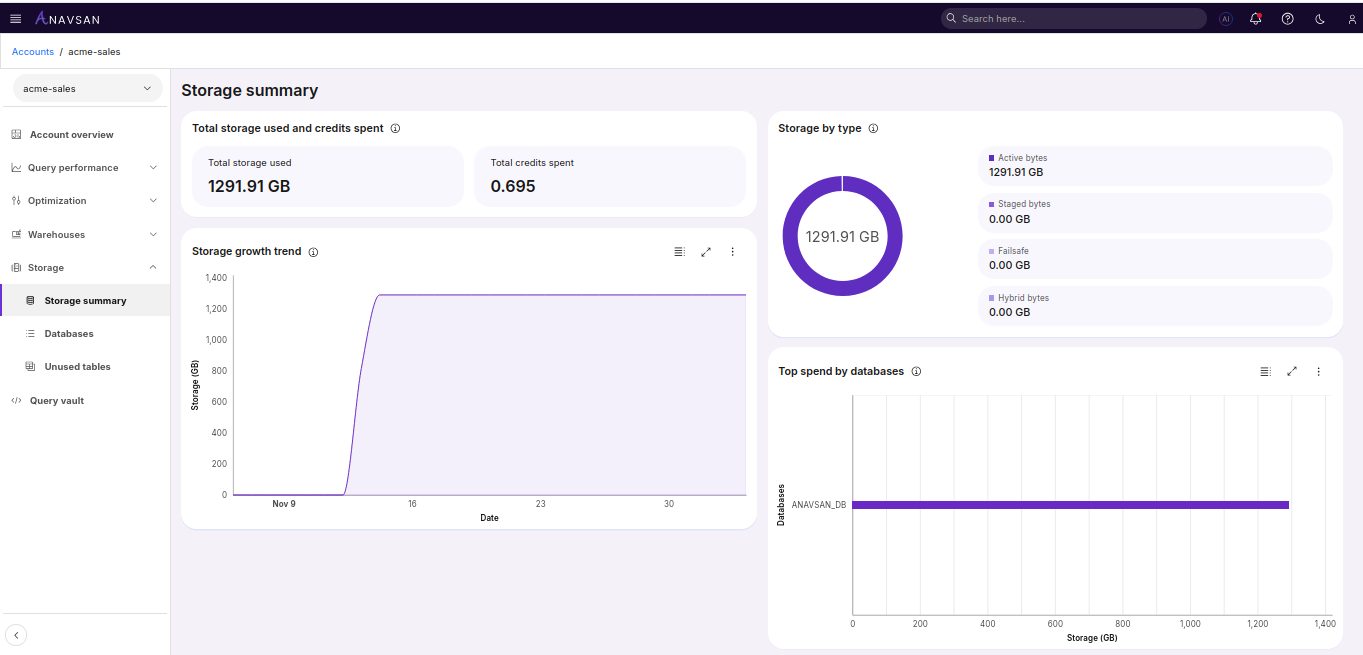
Storage Summary
The Storage dashboard delivers a Snowflake‑native overview of how data is stored, retained, and billed across the account. It provides real‑time visibility into storage distribution, helping FinOps teams and data engineers identify cost‑heavy storage patterns and prioritize optimization actions.
Why It Matters
Storage costs in Snowflake can grow silently. The Storage Summary dashboard provides the visibility and control needed to clean up waste, optimize retention, and ensure storage spending aligns with real data usage and business value.
Total Storage Used and Credits Spent
Displays two high-level metrics summarizing the account’s current storage state:
Total Storage Used — Total storage (in GB) consumed across all databases and storage layers.
Total Credits Spent — Snowflake credits consumed for storage retention and other storage-related operations.
These metrics give a quick estimate of overall storage utilization and its direct cost impact.
Storage by Type
Details how storage is distributed across Snowflake’s core components:
Active Storage — Storage for active tables, schemas, and databases; usually the largest cost contributor.
Stage Storage — Internal stage files, temporary data, and load artifacts.
Failsafe Storage — Long-term recovery storage maintained by Snowflake.
Hybrid Tables Storage — Storage consumed by hybrid table workloads (if applicable).
This layered view highlights which components generate the most storage usage and potential cost.
Storage Growth Trend
A clear and interactive line chart that visualizes your storage usage as it evolves over time.
Chart Details
- X-axis: Dates
- Y-axis: Storage in GB
Top Storage-Consuming Databases
This horizontal bar chart highlights the databases consuming the most Snowflake storage. It enables teams to quickly identify high-impact optimization targets and prioritize cleanup or retention efforts effectively.
Chart Details
X-axis: Storage bytes consumed
Y-axis: Database name
Ordering: Highest to lowest storage usage
Bars: Longer bars indicate higher storage consumption
Usage & Navigation
Users can click on any bar or database name to open the Database Detail View
How FinOps Teams Use This Data
The Storage Summary supports multiple FinOps and DataOps workflows:
Cost Attribution: Identify which databases are driving storage spend.
Optimization Prioritization: Focus on the top databases that typically drives the majority of storage cost.