All Queries
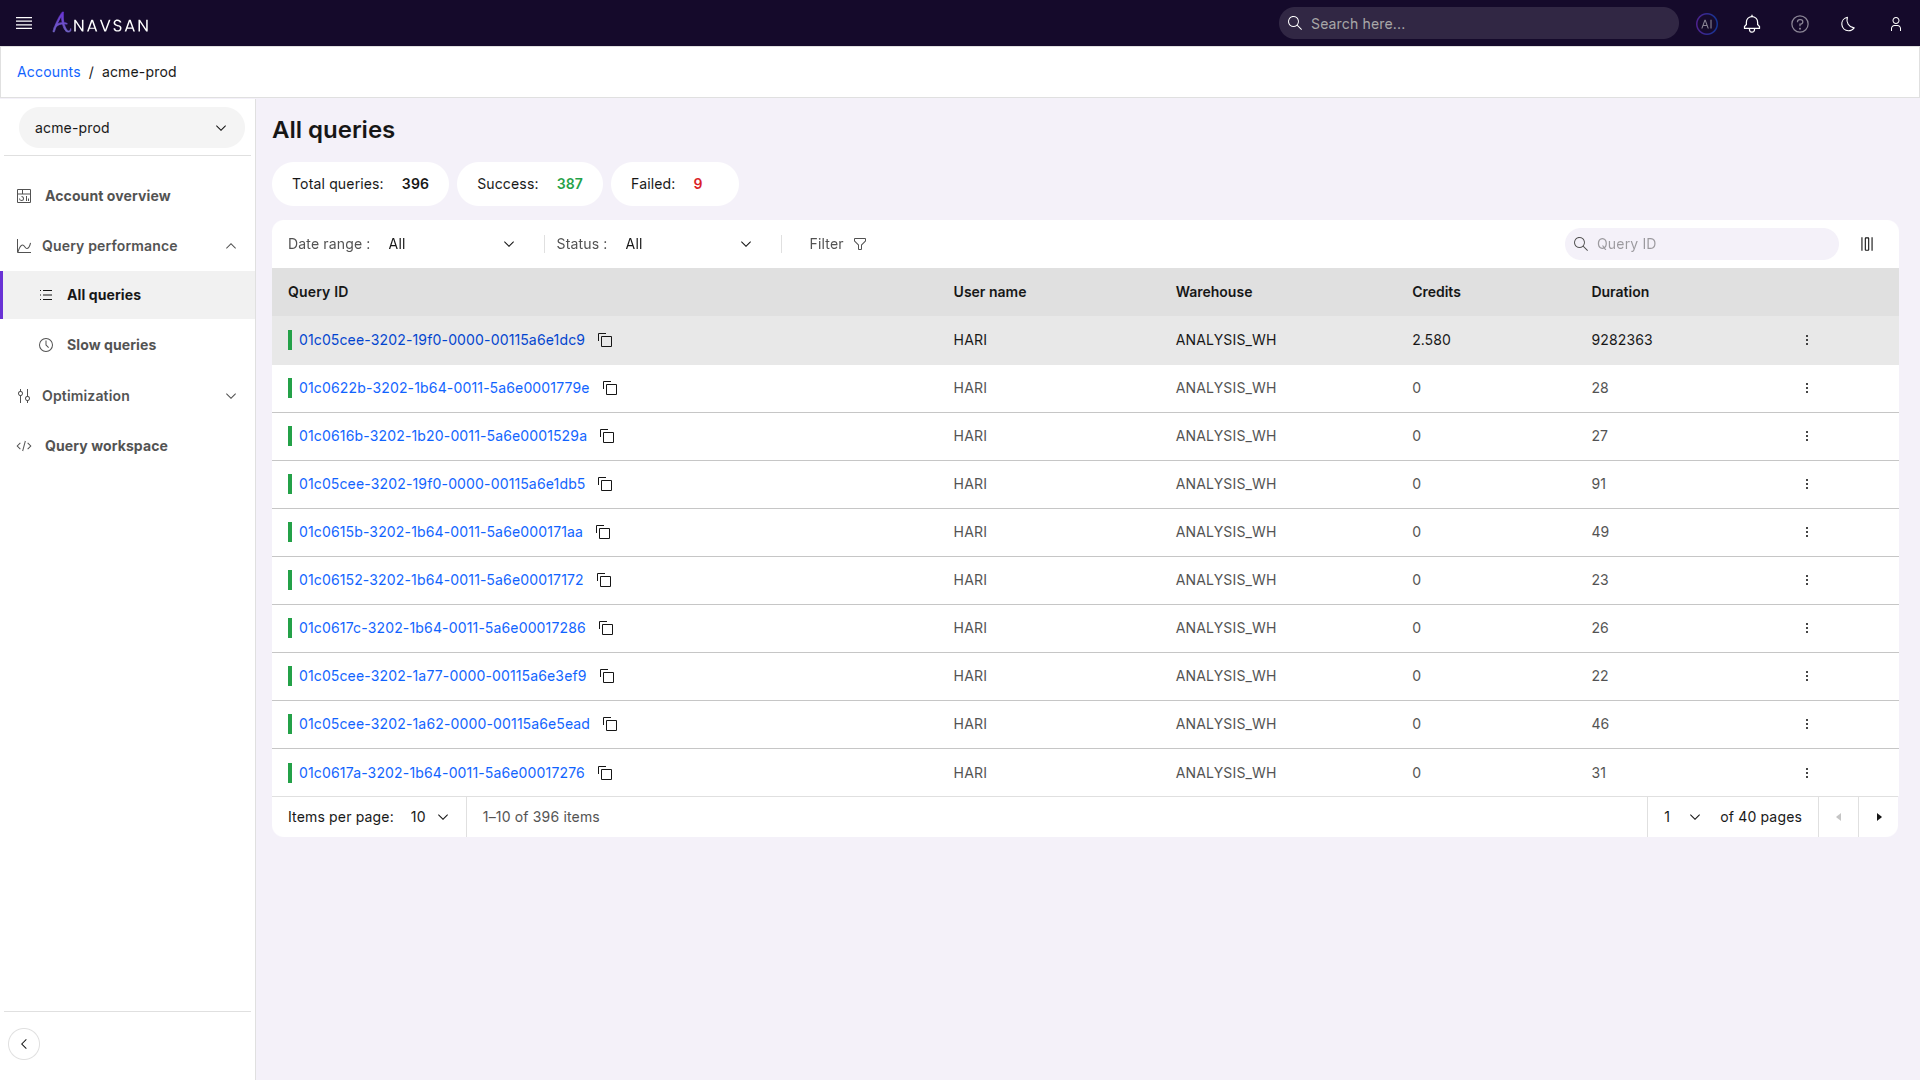
This page provides a searchable, filterable view of all queries executed on your Snowflake account. This view enables FinOps to monitor query performance trends, identify cost drivers, and route optimization tasks to the appropriate owner.
Executed Queries
Query Statistics
The top section displays key metrics about your queries:
- Total Queries - Total number of executed queries
- Success - Number of successfully executed queries
- Failed - Number of queries that encountered errors
Filters and Search
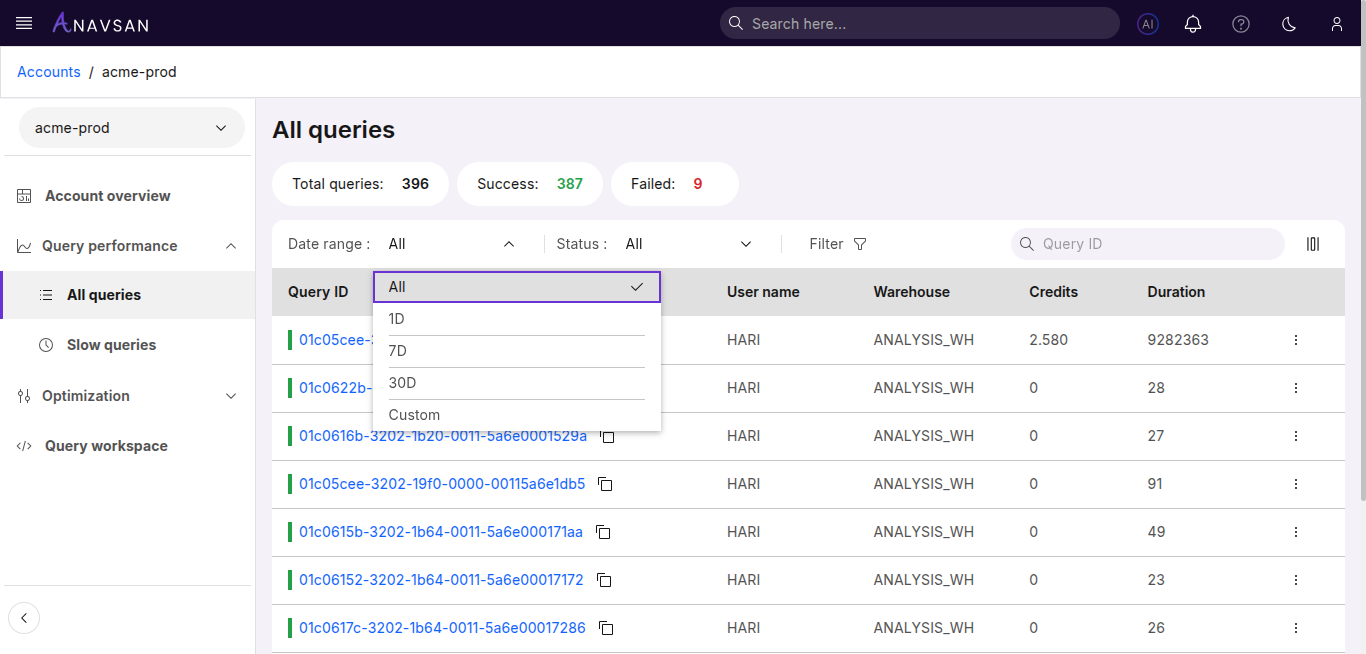
Date Range Filter
Filter queries by time period:
- All - Shows all queries regardless of date (default)
- Last 24 hours - Shows queries executed in the past 24 hours
- Last 7 days - Shows queries executed in the past week
- Last 30 days - Shows queries executed in the past month
- Custom range - Select specific start and end dates for filtering
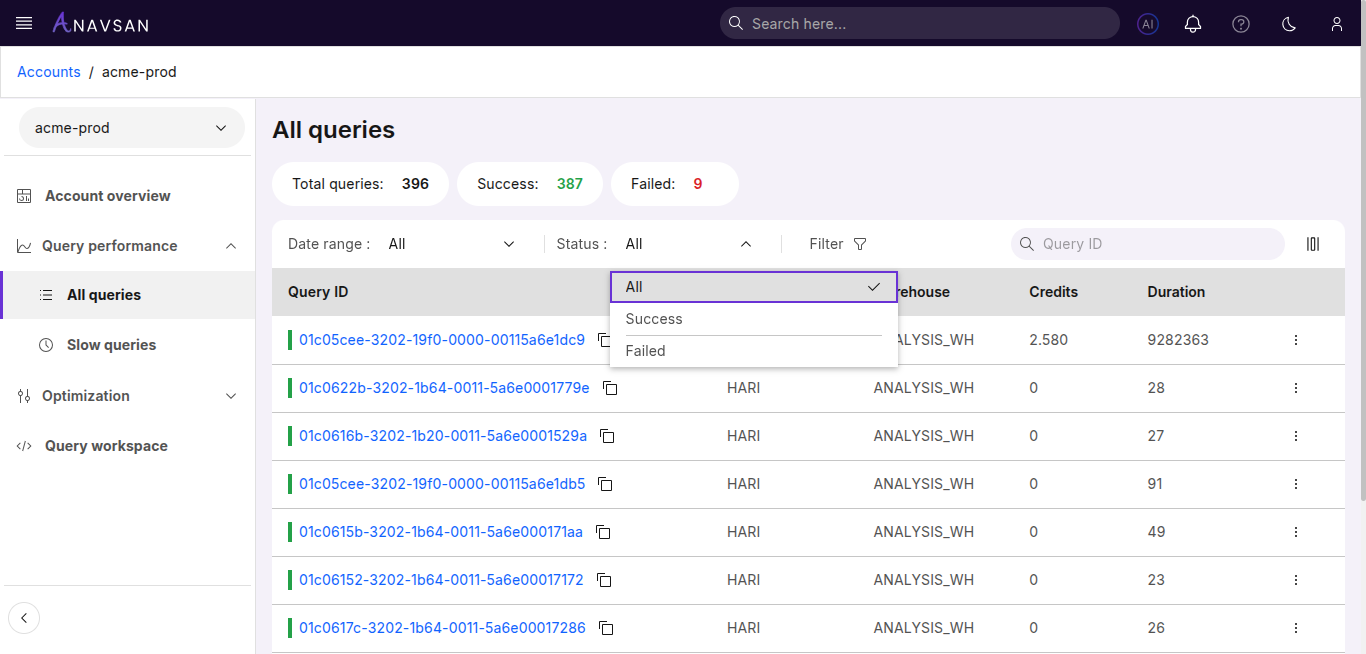
Status Filter
Filter queries by execution status:
- All - Shows queries with any status (default)
- Success - Shows only successfully completed queries
- Failed - Shows only queries that encountered errors
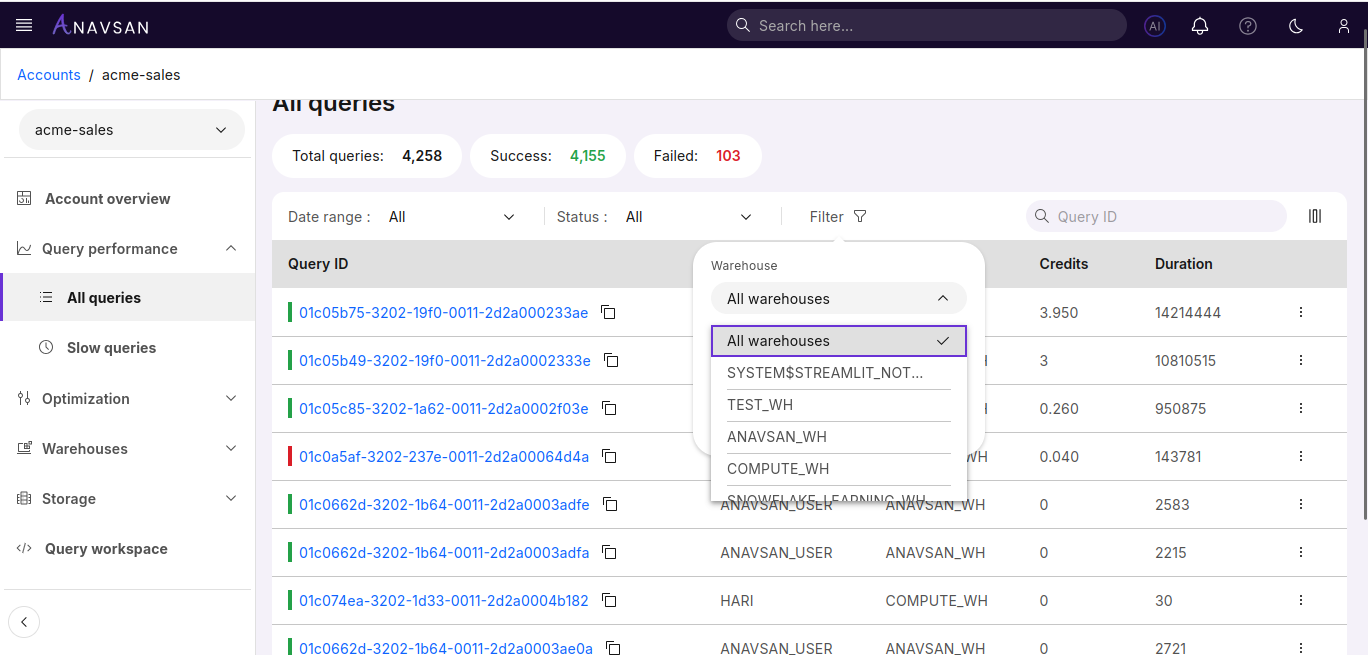
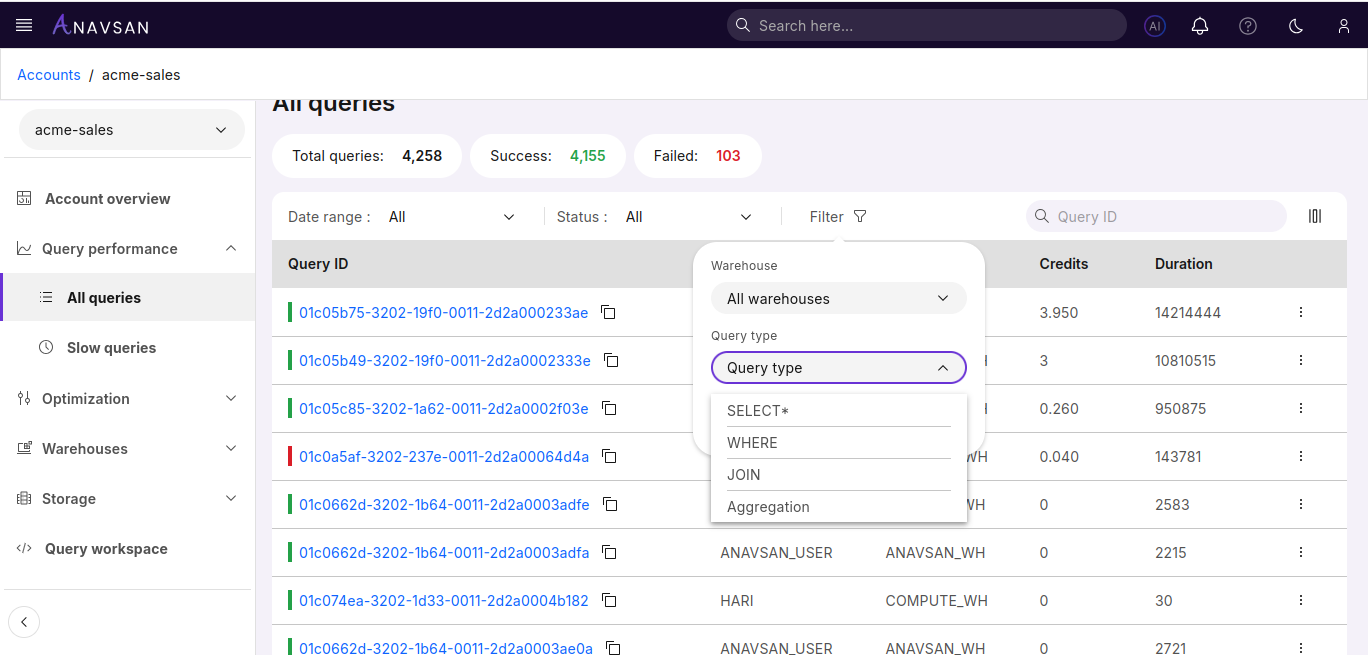
Warehouse Filter
You can filter the list of queries by selecting the warehouse from the dropdown. Only queries executed on the selected warehouse will be displayed.
Query Type Filter
Filter queries by operation type:
- SELECT* - Queries using SELECT with wildcard (SELECT *)
- WHERE - Queries with WHERE clause filtering
- JOIN - Queries performing table joins
- Aggregation - Queries using aggregate functions (SUM, COUNT, AVG, etc.)
Query ID Search
Search for specific query by entering full query ID. Results update as you type.
Edit Columns
Customize which table columns are visible. Show or hide specific data fields to personalize your view.
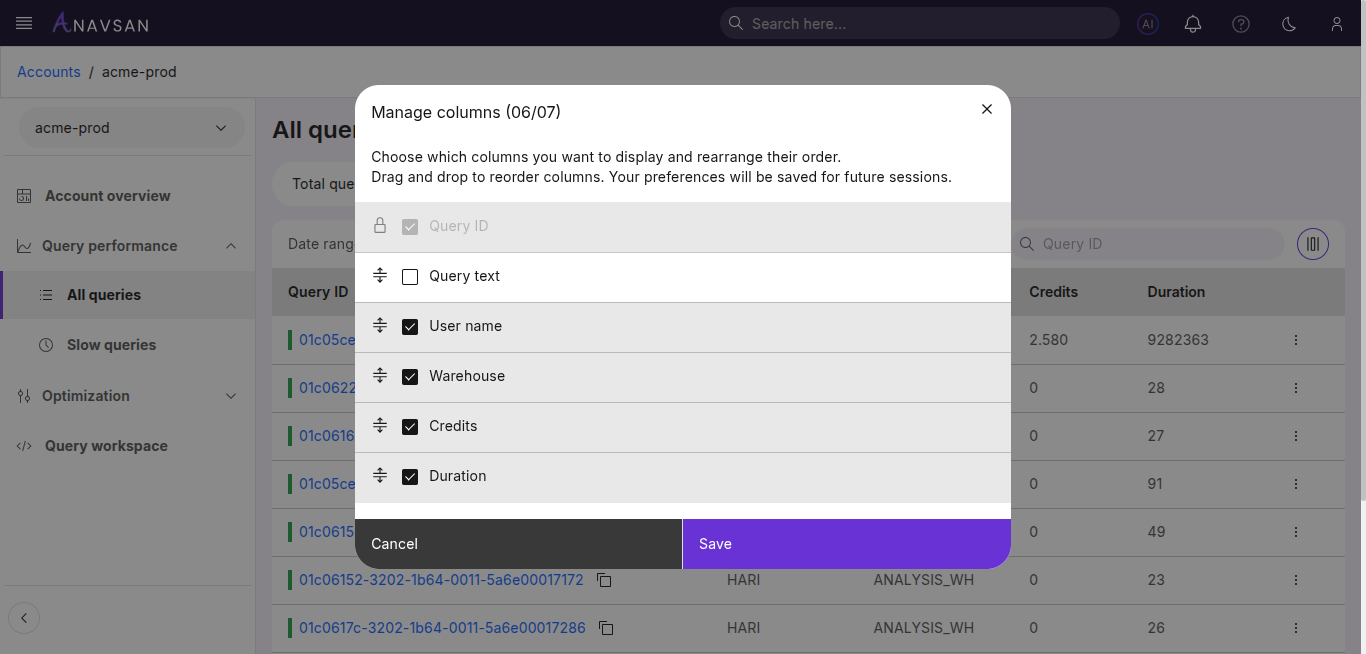
Table Columns
| Column | Description | Use Case |
|---|---|---|
| Query ID | Unique identifier for each query | Click to view query details or use copy button to share query reference |
| User Name | Snowflake user who executed the query | Identify query ownership and analyze performance patterns by user |
| Warehouse | Warehouse used to execute the query | Identify compute resources used and optimize warehouse allocation |
| Credits | Number of credits consumed by the query | Track query credit and prioritize optimization for expensive queries |
| Duration | Query execution time in milliseconds | Identify slow queries and measure optimization impact |
Table Features
Sorting
Click column headers to sort queries in ascending or descending order. Sorting is available for:
- User Name - Sort alphabetically by user
- Warehouse - Sort alphabetically by warehouse name
- Credits - Sort by credit consumption (low to high or high to low)
- Duration - Sort by execution time (shortest to longest or longest to shortest)
Additional Features
- Clickable Query IDs - Click any query ID to view full query details and analysis
- Copy Query ID - Single click to copy query ID to clipboard
Available Actions
The Actions column displays a three-dot menu icon (⋮) for each query, providing quick access to query operations.
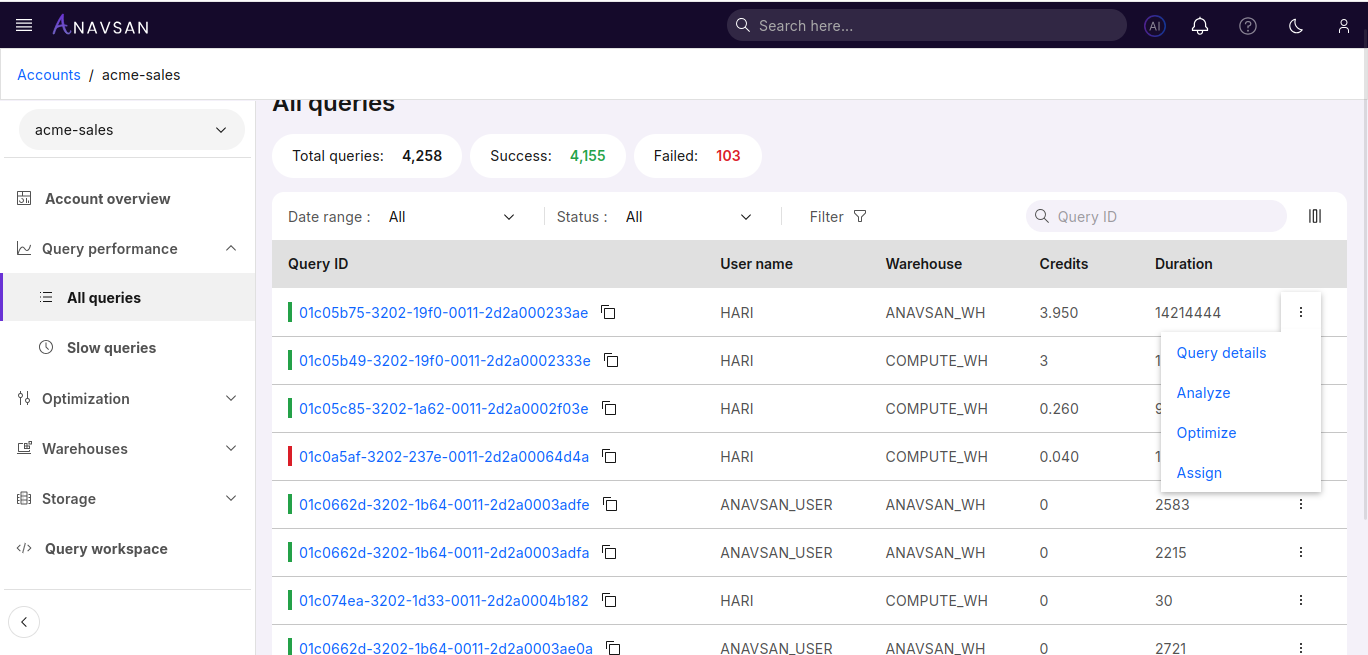
Query Details
Opens the detailed query information page showing complete query text, execution plan, and performance metrics.
Analyze
Opens the Query Analyzer tool with the selected query pre-loaded to evaluate execution patterns, resource usage, and identify performance inefficiencies.
Optimize
Opens the Query Optimizer tool with the selected query pre-loaded to receive AI-powered optimization suggestions and query restructuring recommendations.
Assign
Assign the query to a user along with priority and notes.
Assign Query
Users can assign a query to another team member through the Assign query action in the row menu.
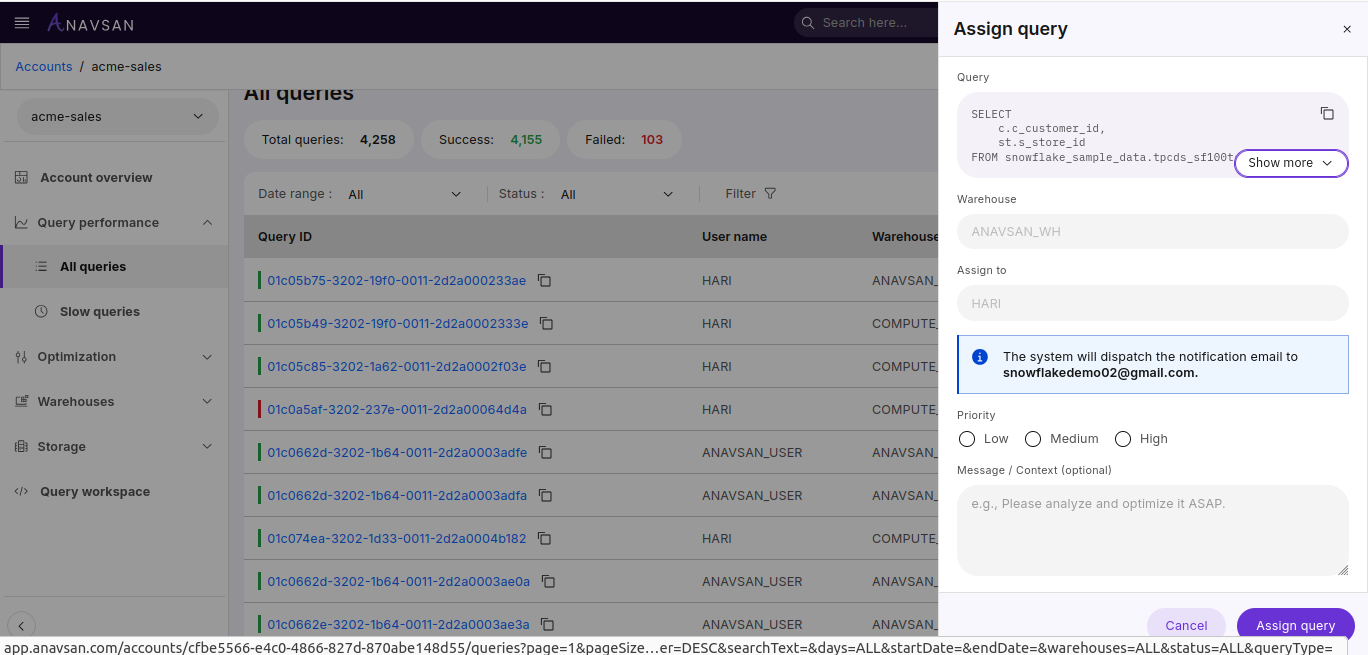
The panel displays:
- Query
- Warehouse
- The Assign to field showing the owner of the query executor
Manual Email Entry
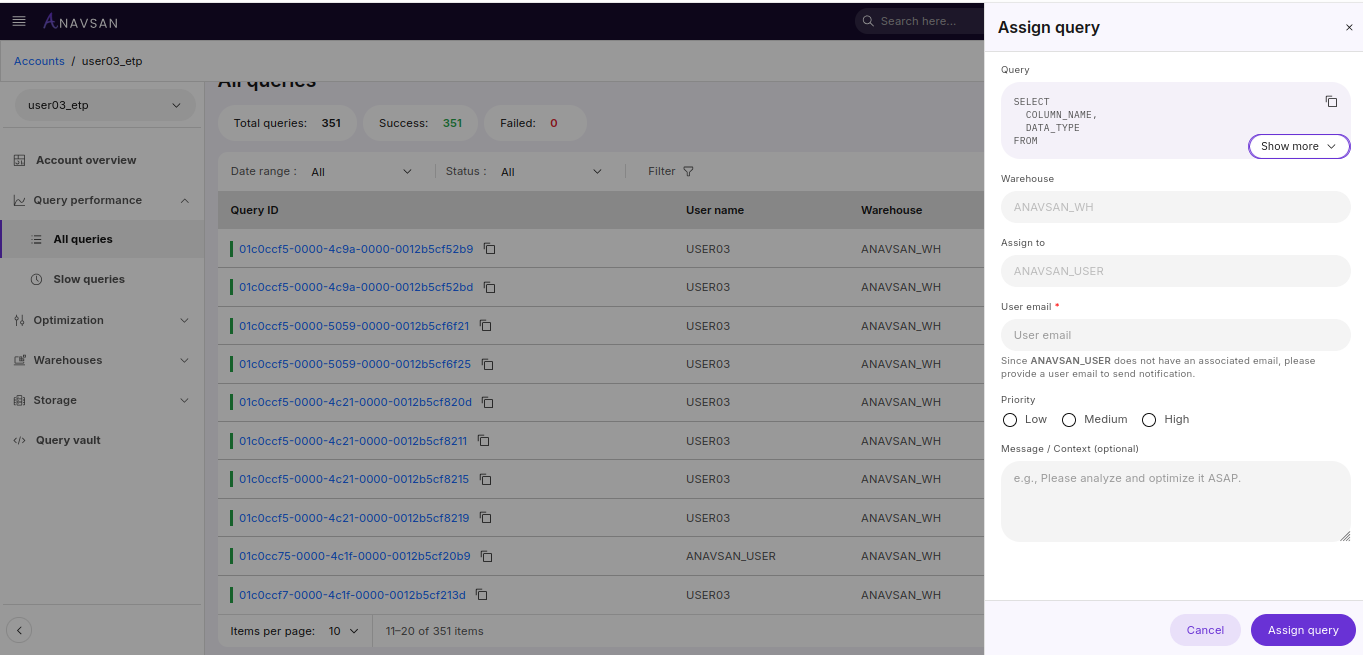
If the assigned user does not have an email address registered in their account, an Email field appears below the assign to field. You must manually enter the user's email address to ensure they receive the assignment notification.
Email Notification
A message appears indicating that an email notification will be sent to the assigned user's email address.
Note: If you manually entered an email address (when the user had no registered email), the notification will be sent to the email address you provided.
Completing the Assign Action
- Click Assign query to complete the assignment
- Click Cancel to close the panel without making changes
Query Details
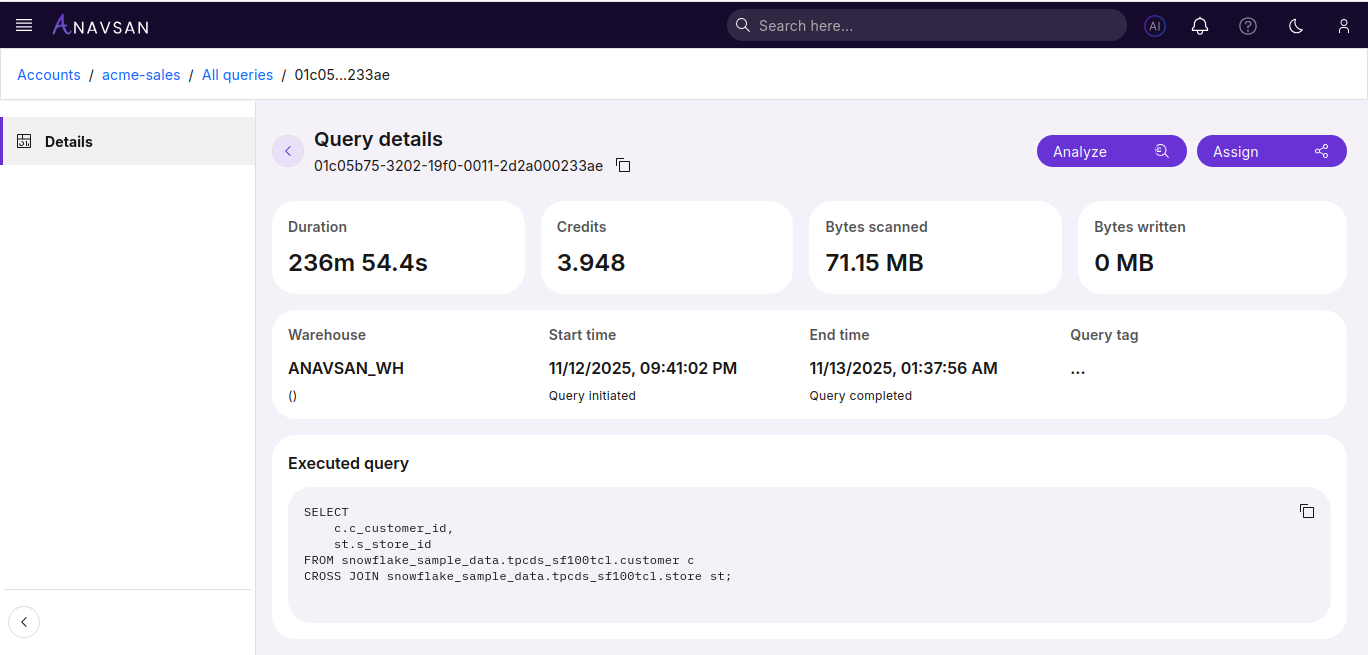
The Query Details page provides a complete breakdown of a selected query, including performance metrics, warehouse usage, resource consumption, and executed SQL text. This helps you understand execution behavior, identify performance issues, and analyze resource usage.
Key Metrics
The top section displays core execution statistics:
| Metric | Description |
|---|---|
| Duration | Total time taken to execute the query |
| Credits | Number of Snowflake credits consumed by the query |
| Bytes Scanned | Amount of data scanned during execution |
| Bytes Written | Data written as part of the query output |
Execution Information
| Field | Description |
|---|---|
| Warehouse | The warehouse used to execute the query |
| Start Time | The timestamp when execution began |
| End Time | The timestamp when execution completed |
| Query Tag | Custom tag applied to the query (if available) |
Executed Query
Displays the full SQL text executed by the user.
Use the copy icon to copy the entire query to clipboard for sharing or further analysis.
Next Steps
Click Analyze to open the Query Analyzer with the executed query preloaded.
Use Analyzer to review execution plan, understand performance characteristics, and identify optimization opportunities.
Click Assign to assign the query to the user who executed it. This helps ensure that the person who ran the query receives the task for review or action.