Query Logs
The Query Logs page allows FinOps users to view and filter all analyzed or optimized or simulated queries stored in the system.
Query Logs List
When queries exist in the library, the page displays them in a structured table along with category counts.
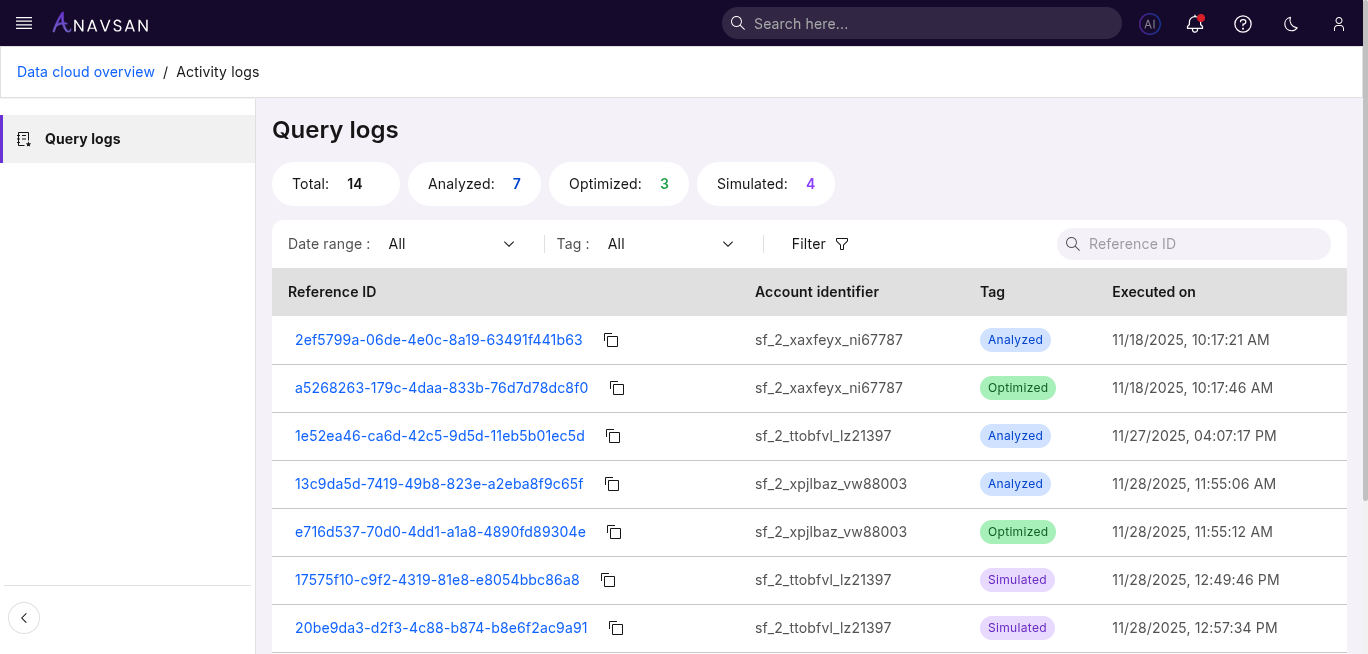
Query Counts
Badges at the top show how many queries exist in each category:
- Total — All stored library queries
- Analyzed — Queries that have undergone analysis
- Optimized — Queries with implemented optimizations
- Simulated — Queries tested in a simulation environment before actual execution
These counts help FinOps users quickly understand how stored queries are distributed.
Table Columns
| Column | Description | Use Case |
|---|---|---|
| Reference ID | Unique identifier for the stored query entry. | Locate and open the saved query. |
| Account Identifier | The Snowflake account associated with the query. | Understand which account the query belongs to. |
| User Name | The user who analyzed or optimized the query. | Track who performed the work. |
| Tag | Indicates whether the query is Analyzed or Optimized or Simulated. | Filter and categorize saved queries based on workflow stage. |
| Executed on | Timestamp showing when the query was originally executed. | Review when the query ran for context and historical tracking. |
Sorting
The following columns support sorting:
- User Name
- Tag
- Executed On
Click a column header to toggle ascending or descending order.
Filters
Filters help narrow down the query library to relevant items.
Date Range Filter
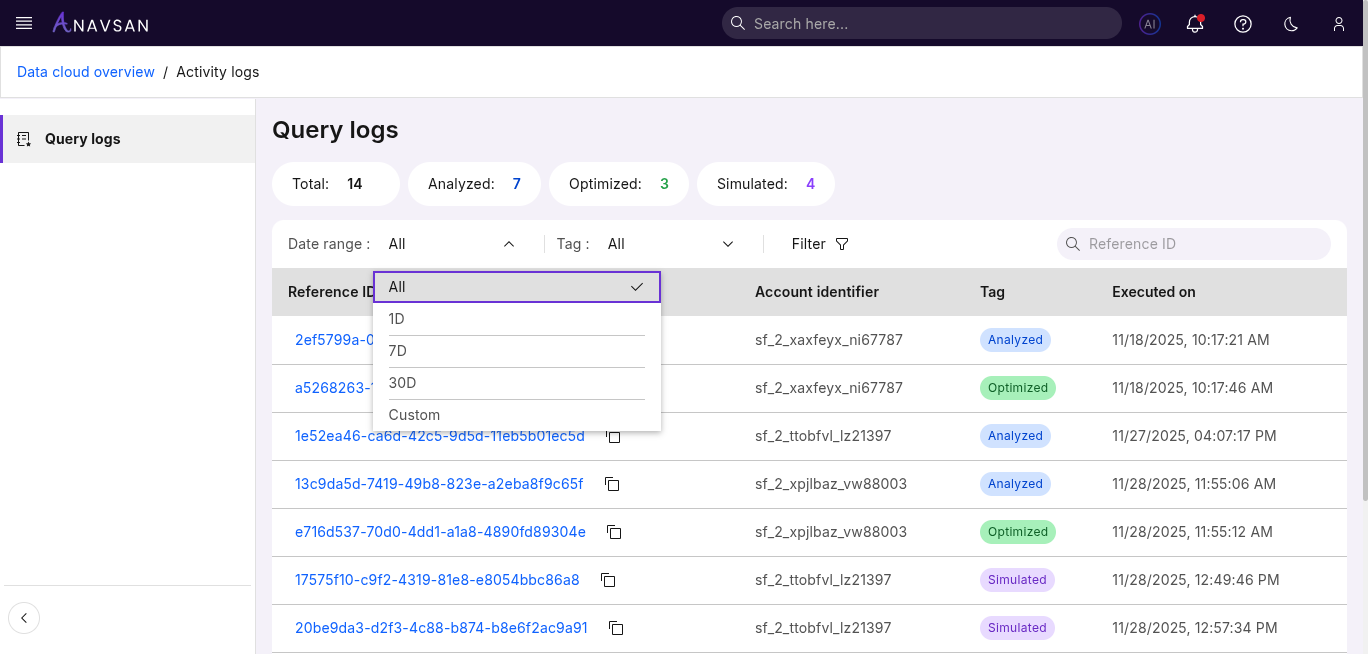
Choose from preset or custom date ranges:
- All — Shows all stored queries
- 1D — Queries from the last 24 hours
- 7D — Queries from the past week
- 30D — Queries from the past month
- Custom — Select a custom start and end date
Account Filter
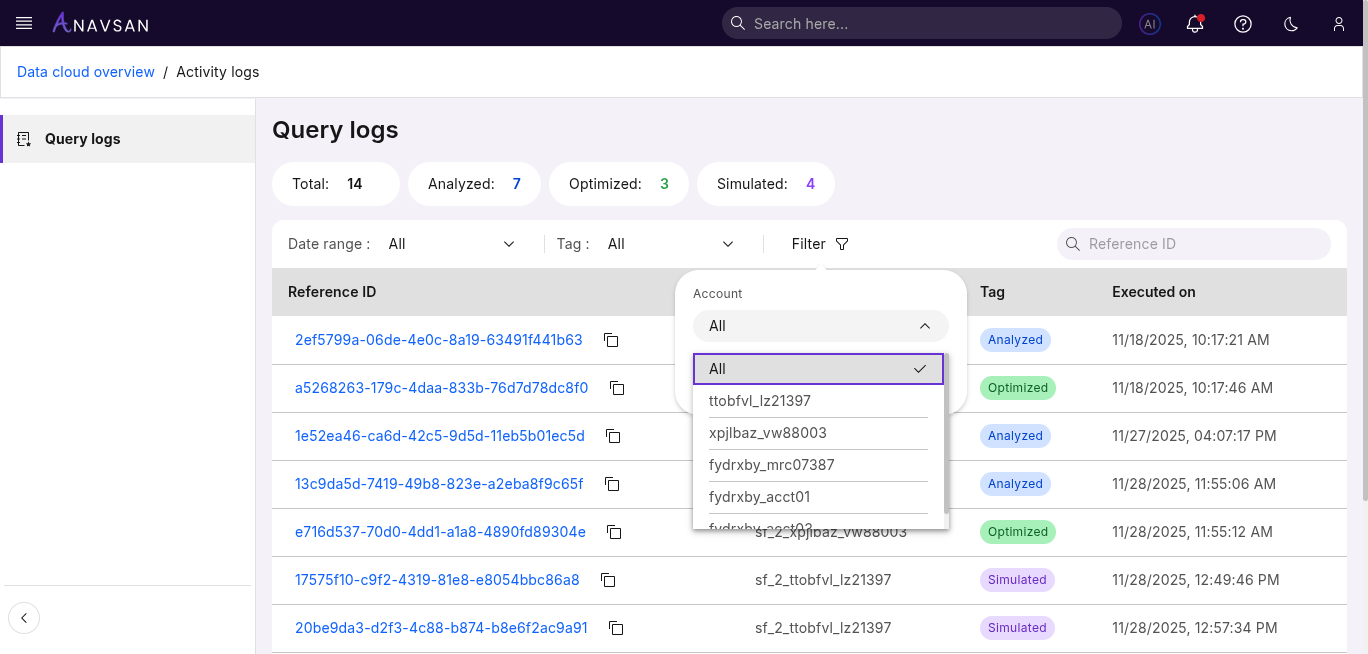
Use this filter to show queries executed under specific Snowflake accounts.
Options include:
- All accounts
- Any individual connected account
Tag Filter
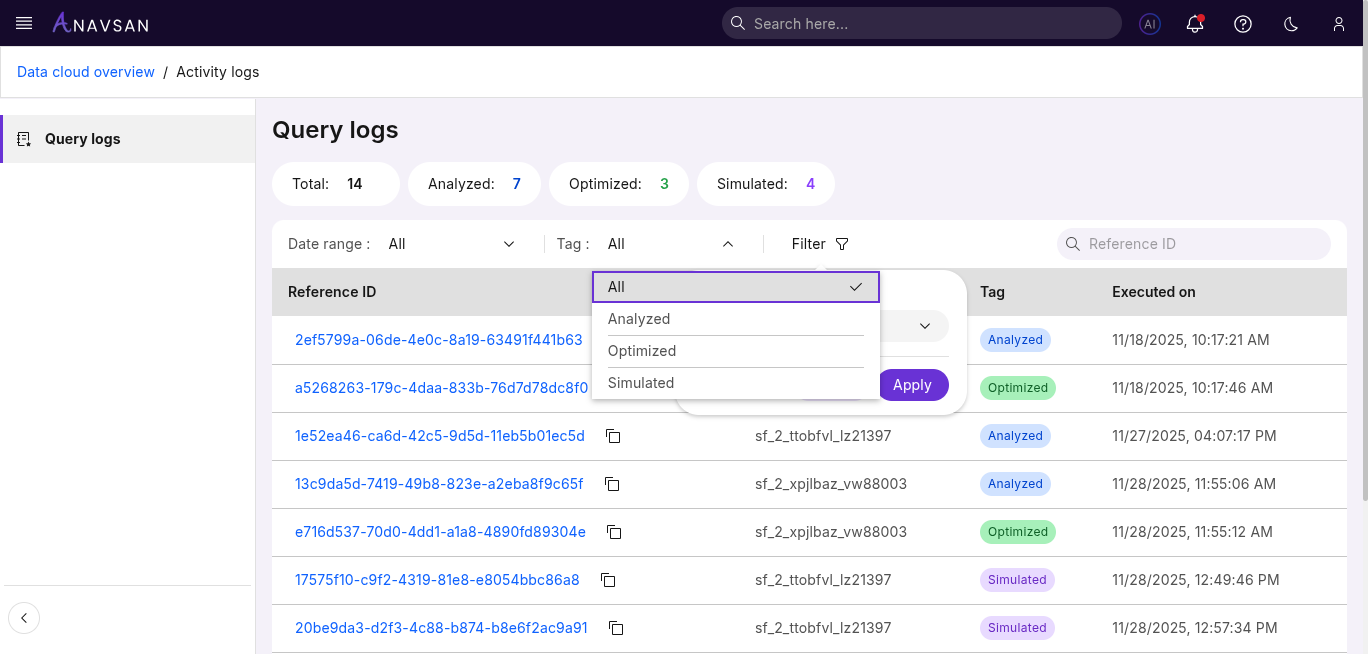
Filter queries based on their classification tags:
All — Shows every query in the library
Analyzed — Shows queries that were analyzed
Optimized — Shows queries that were optimized
Simulated — Shows queries that were simulated
This helps users quickly switch between analyzed, optimized and simulated query groups.
Reference ID Search
A search bar allows quick lookup by reference id.
Analyzer, Optimizer & Simulated History
Clicking any Reference ID opens the Query Logs Details page.
Depending on the query type, users will see either the Analyzer History or Optimizer History or Simulator History view.
Analyzer History
Displayed when the query was analyzed.
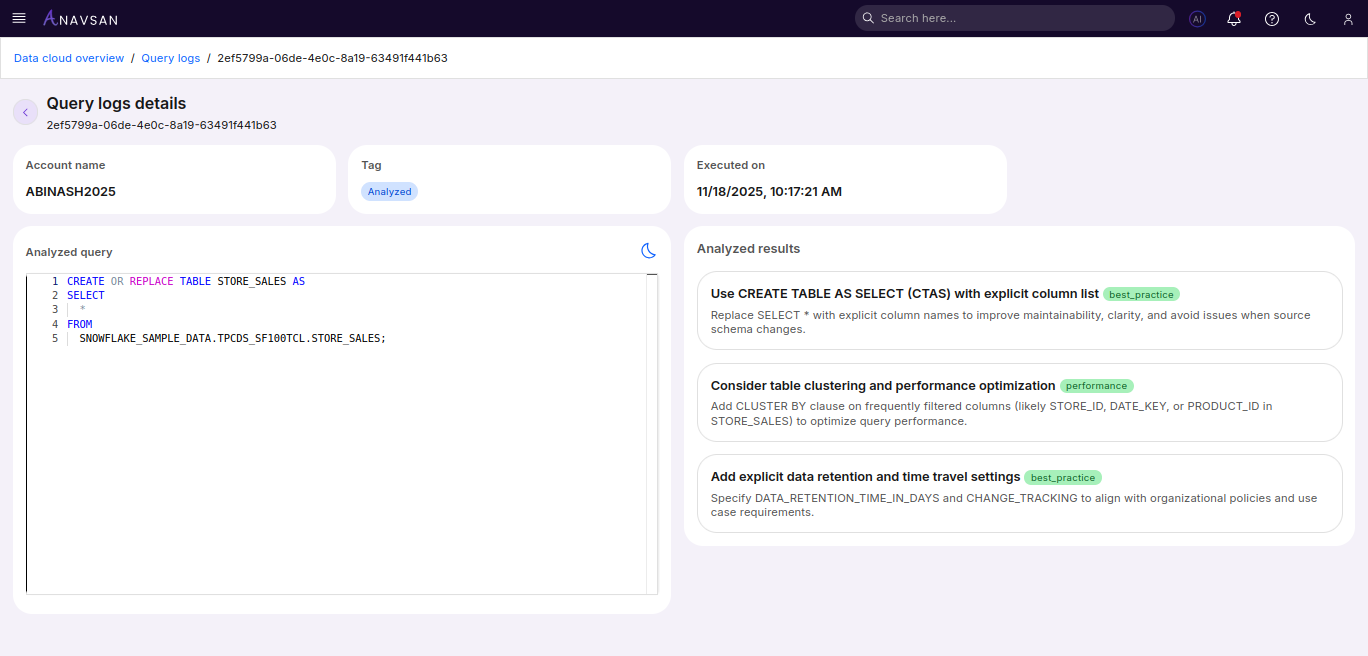
This view includes:
- Account name
- User name
- Tag (Analyzed)
- Executed on
- Full analyzed query
- Detailed analysis results
Useful for understanding inefficiencies or best-practice recommendations.
Optimizer History
Displayed when the query was optimized.
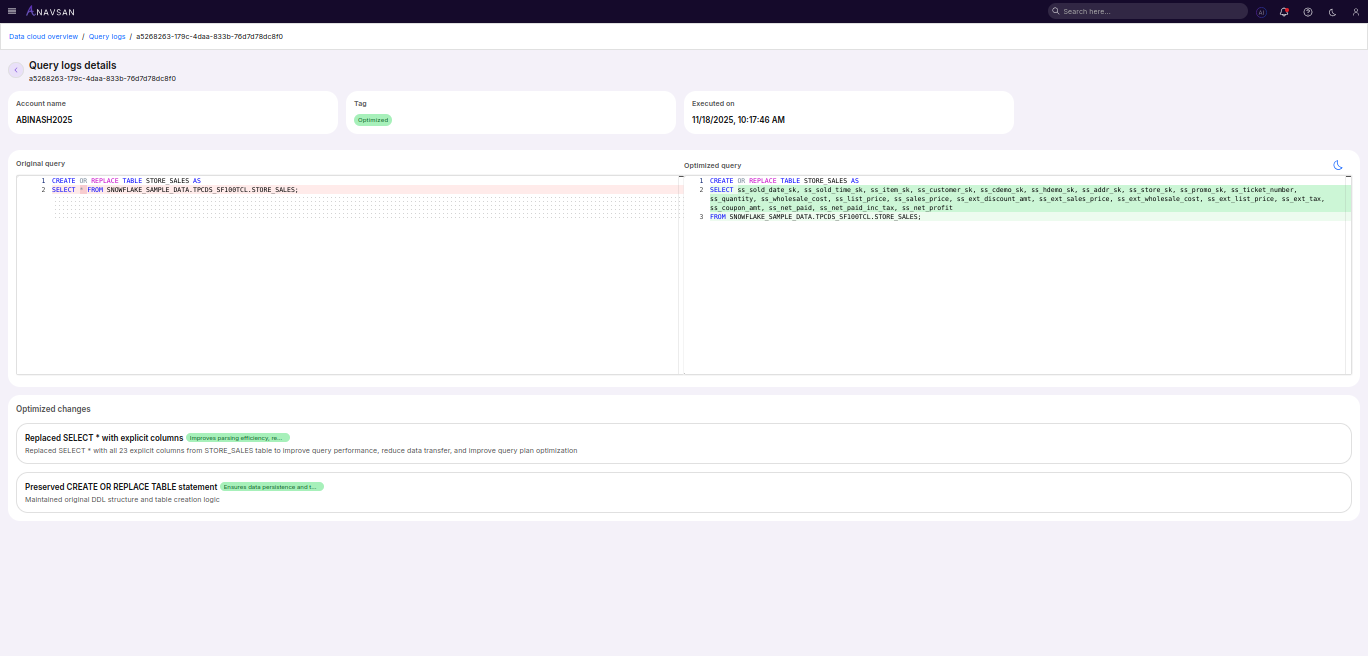
This view includes:
- Account name
- User name
- Tag (Optimized)
- Executed on
- Original query on the left
- Optimized query on the right
- Optimization changes listed below
Helpful for reviewing improvements made to performance, structure, or cost efficiency.
Simulator History
Displayed when the query was simulated.
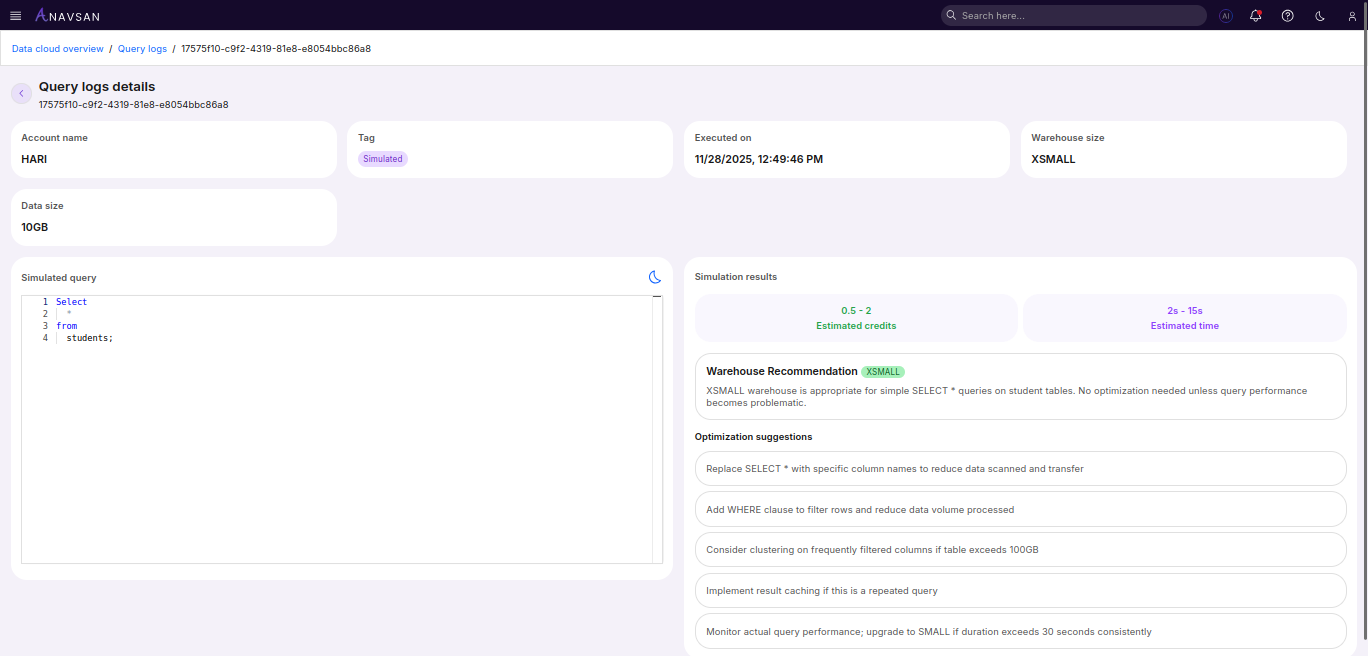
This view includes:
- Account name
- User name
- Tag (Simulated)
- Executed on
- Warehouse size
- Data size
- Simulated query
- Simulation results and metrics
Useful for understanding query performance under different warehouse configurations before actual execution.