Slow Queries
The Slow Queries page displays a comprehensive list of all SQL queries that exceeded the configured slow-execution threshold. This page helps you monitor slow query performance, identify issues, and analyze slow-running query patterns.
Slow Queries List
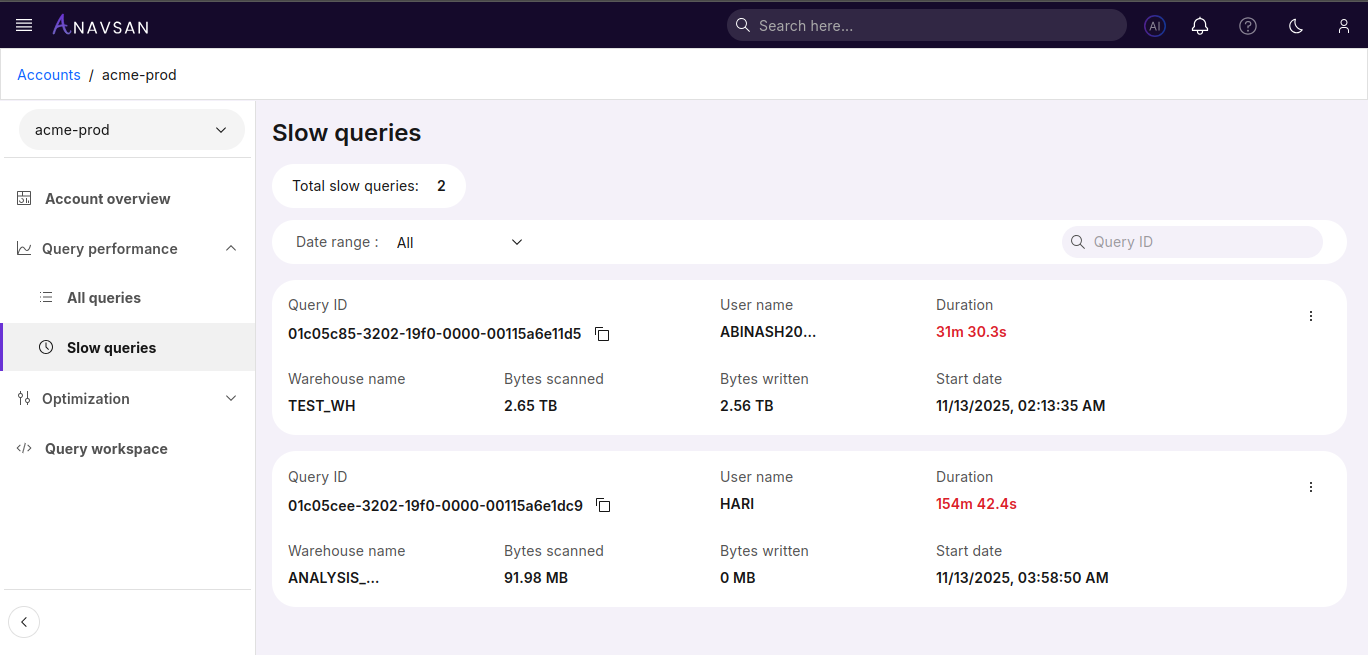
When slow queries exist, they appear in a structured view with summary counts at the top.
Slow Query Statistics
At the top of the page, a summary metric is displayed:
- Total Slow Queries — Shows the total number of queries that exceeded the slow threshold.
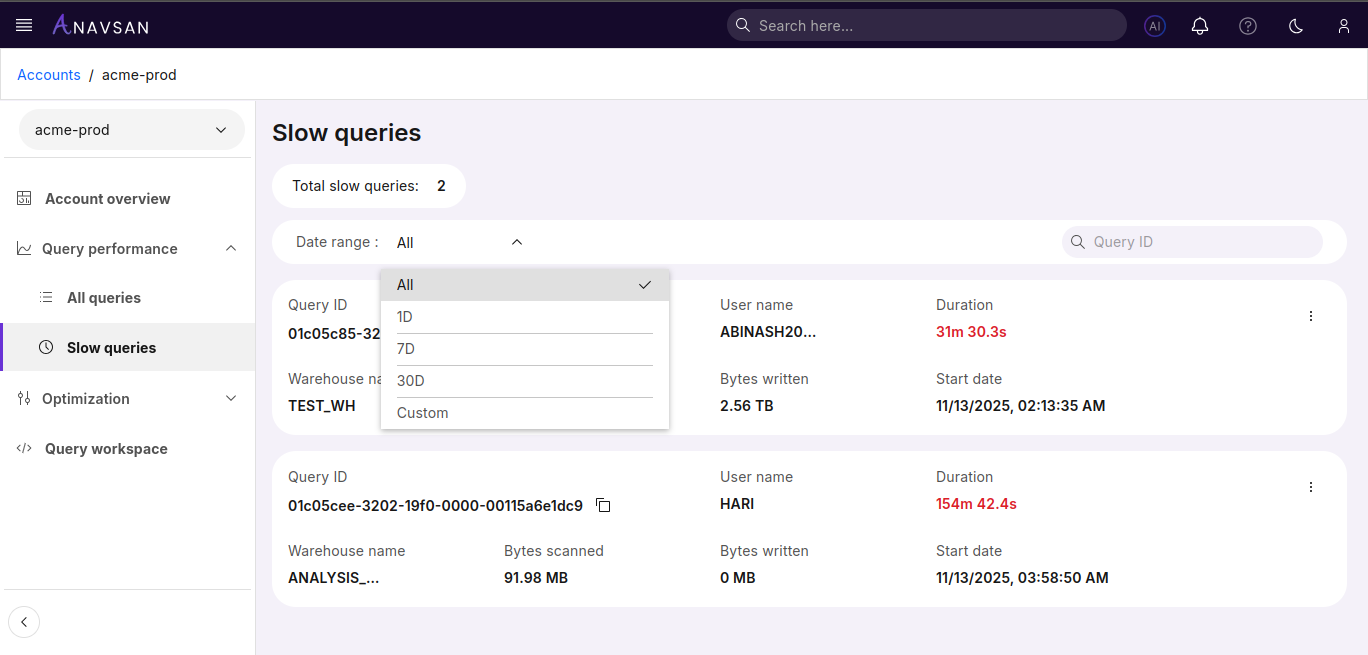
Filters and Search
Date Range Filter
Filter slow queries by time period:
- All - Shows all slow queries regardless of date (default)
- Last 24 hours - Shows slow queries executed in the past 24 hours
- Last 7 days - Shows slow queries executed in the past week
- Last 30 days - Shows slow queries executed in the past month
- Custom range - Select specific start and end dates for filtering
Query ID Search
Search for specific query by entering full query ID. Results update as you type.
Slow Query Attributes
| Field | Description | Use Case |
|---|---|---|
| Query ID | Clickable unique query identifier with a copy button | Share or reference the query easily |
| Warehouse Name | Warehouse where the query executed | Identify which warehouse is handling heavy workloads |
| User Name | User who ran the query | Track query ownership and usage patterns |
| Bytes Scanned | Total data scanned | Detect expensive scans requiring optimization |
| Bytes Written | Total data written | Identify write-heavy operations |
| Duration | Total execution time (displayed in red) | Quickly spot long-running queries |
| Start Date/Time | Timestamp when the query started | Relate slow queries with usage spikes or scheduled jobs |
Available Actions
Displays a three-dot menu icon (⋮) for each query, providing quick access to query operations.
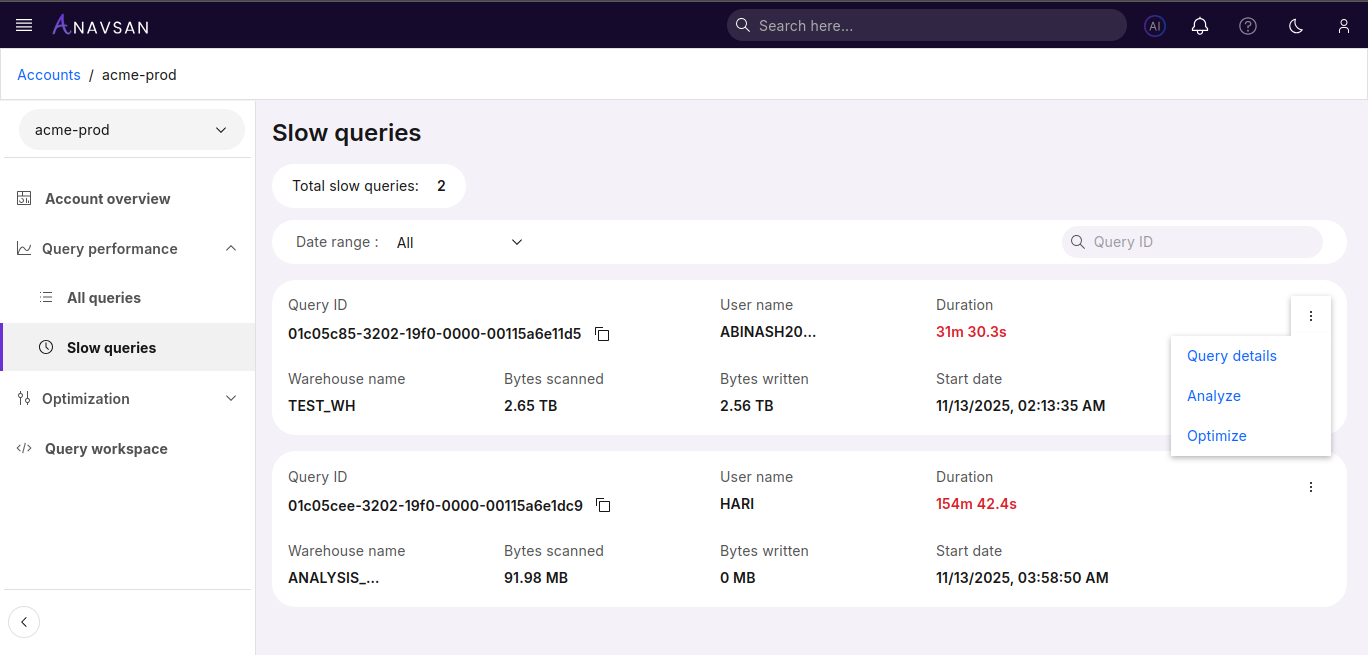
Query Details
Opens the detailed query information page showing complete query text, execution plan, and performance metrics.
Analyze
Opens the Query Analyzer tool with the selected query pre-loaded to evaluate execution patterns, resource usage, and identify performance inefficiencies.
Optimize
Opens the Query Optimizer tool with the selected query pre-loaded to receive AI-powered optimization suggestions and query restructuring recommendations.
Query Details
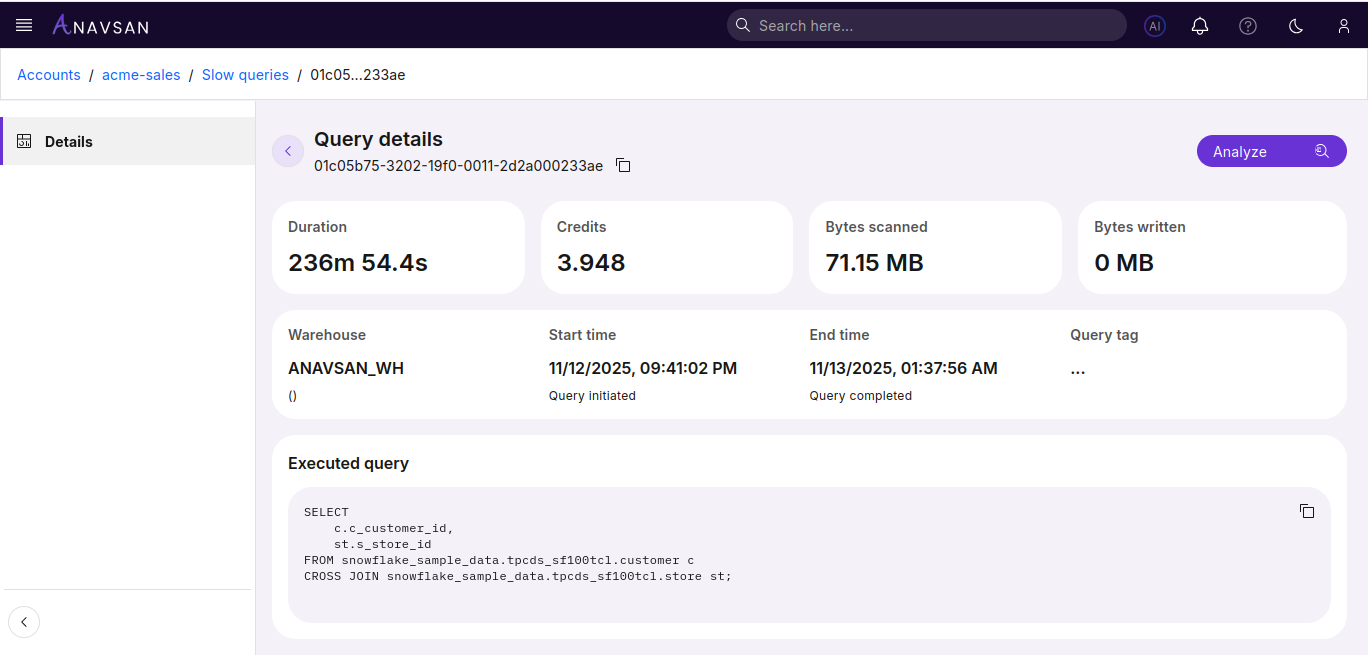
The Query Details page provides a complete breakdown of a selected query, including performance metrics, warehouse usage, resource consumption, and executed SQL text. This helps you understand execution behavior, identify performance issues, and analyze resource usage.
Key Metrics
The top section displays core execution statistics:
| Metric | Description |
|---|---|
| Duration | Total time taken to execute the query |
| Credits | Number of Snowflake credits consumed by the query |
| Bytes Scanned | Amount of data scanned during execution |
| Bytes Written | Data written as part of the query output |
Execution Information
| Field | Description |
|---|---|
| Warehouse | The warehouse used to execute the query |
| Start Time | The timestamp when execution began |
| End Time | The timestamp when execution completed |
| Query Tag | Custom tag applied to the query (if available) |
Executed Query
Displays the full SQL text executed by the user.
Use the copy icon to copy the entire query to clipboard for sharing or further analysis.
Next Steps
Click Analyze to open the Query Analyzer with the executed query preloaded.
Use Analyzer to review execution plan, understand performance characteristics, and identify optimization opportunities.