Data Cloud Overview
The Data Engineer Overview is your entry point to Anavsan's query analysis and optimization tools. This dashboard surfaces expensive queries, performance bottlenecks, and actionable optimization opportunities across your Snowflake environment.
This emphasizes query-level analysis and performance improvements that directly reduce execution time and resource consumption.
Overview
When you connect your Snowflake accounts or when accounts are shared with you, the Overview page becomes a comprehensive dashboard displaying your usage metrics and key analytics.
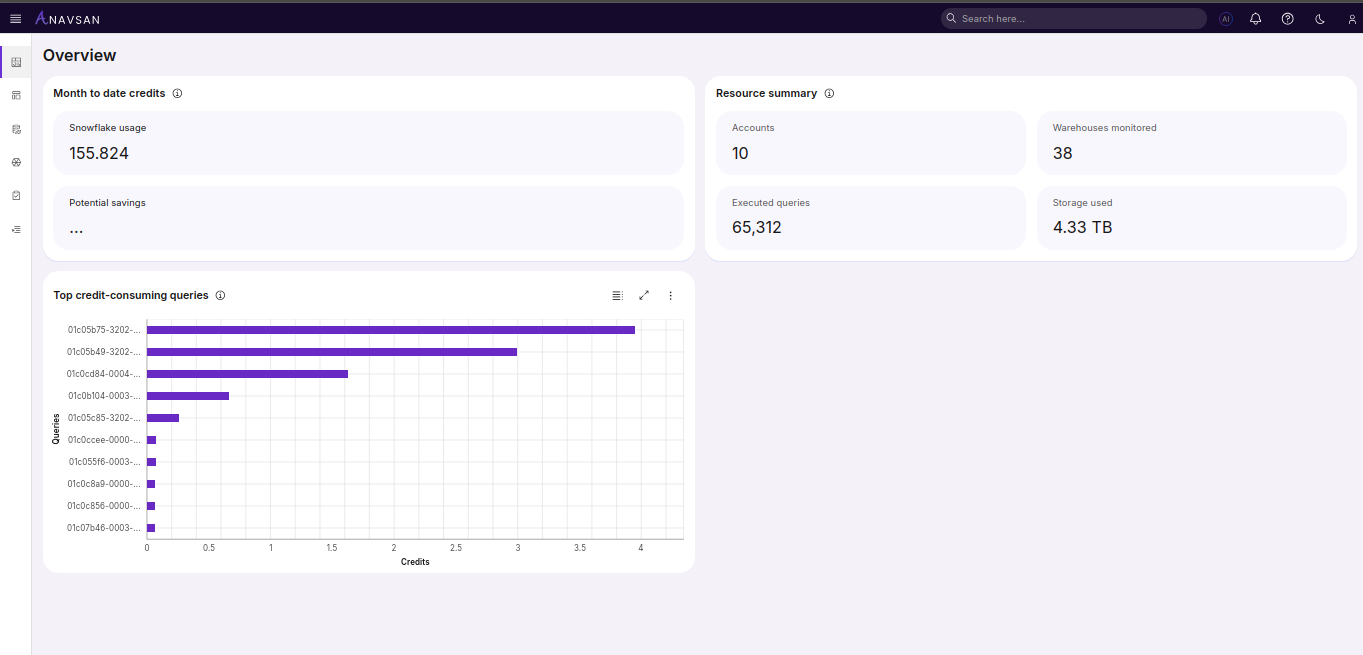
Month to date credits
This section displays the two most critical metrics for budget tracking:
-
Current shows the total Snowflake credits consumed so far this billing month across all connected and shared accounts, aggregated from each account's metadata and helps to determine where you stand relative to your monthly budget. A $10,000 budget with Snowflake's standard $4/credit pricing equates to 2,500 credits. If Current shows 1,200 credits mid-month, you're on track; if it shows 2,000 credits, acceleration is likely.
-
Forecasted projects your end-of-month total based on current daily average consumption rates.
Top credit-consuming queries
A horizontal bar chart ranking the most expensive queries by credit consumption.
- Longer bars indicate higher credit consumption.
- Y-axis shows query IDs.
- X-axis shows total credits consumed.
- Queries are ordered highest-to-lowest by cost.
Key attributes:
- Clicking a bar or query ID opens the Query Details page for that query.
- These queries are candidates for optimization—focus on the top 10–20 to achieve the highest ROI.
This helps Data Engineers to identify which queries consume the most resources. Focus optimization effort on the highest-cost queries first; even small improvements (10–20%) on expensive queries yield significant overall savings.
Resource Summary
-
Accounts Shows the number of Snowflake accounts connected to Anavsan.
-
Warehouses Monitored displays the total number of warehouses included in monitoring across all connected accounts.
-
Executed Queries shows the number of queries executed across all connected accounts.
-
Storage Used displays total Snowflake storage usage in terabytes (TB).
Understand the scale of your infrastructure. High query counts with moderate credit usage indicates good query efficiency. High query counts with high credit usage suggests optimization opportunities.