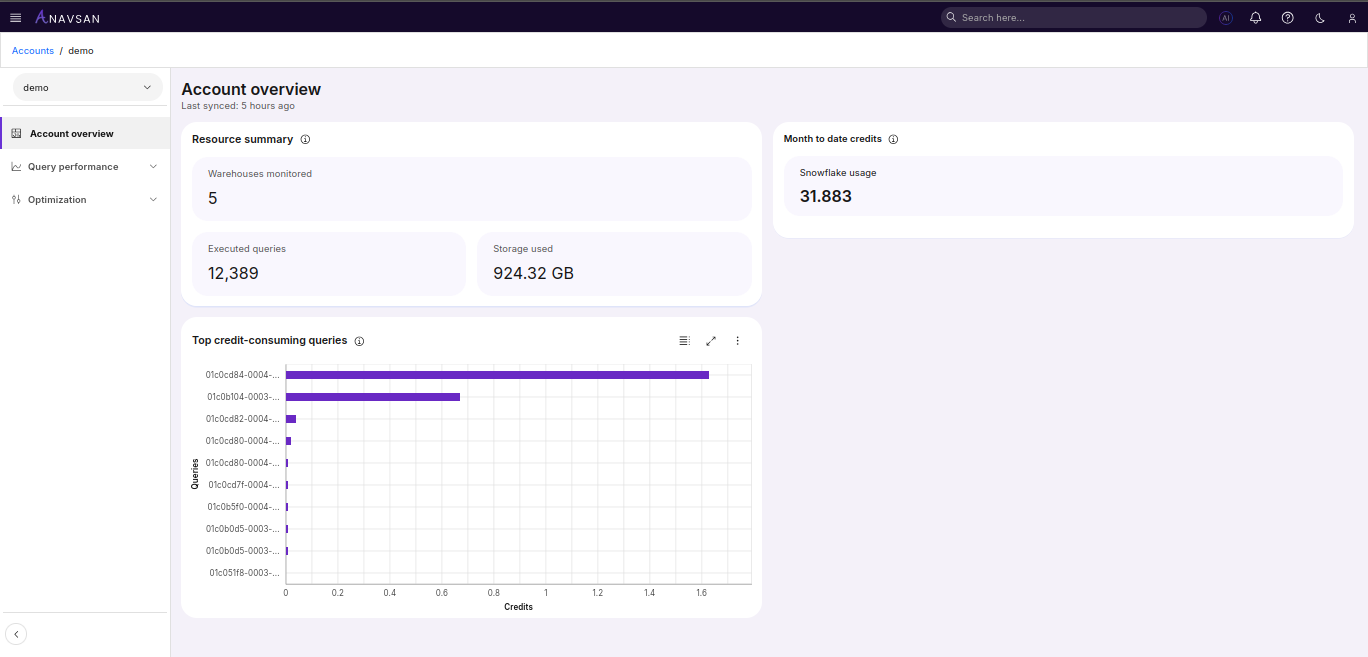
Account Overview
This page presents a consolidated view of usage and spend for a single Snowflake account, enabling Data Engineers to monitor query activity, resource utilization, and identify optimization opportunities.
Data Synchronization
Last synced - Displays the time elapsed since the last data synchronization from Snowflake (e.g., "6 hours ago"). This timestamp helps you understand data freshness and determine if metrics reflect recent query executions.
Month-to-Date Credit Usage
Snowflake Usage shows the total credits consumed for this account in the current billing period.
Resource Summary
The Resource summary panel highlights core activity metrics for the selected Snowflake account over the chosen time range.
- Warehouses monitored – Number of warehouses that Anavsan is tracking in this account.
- Executed queries – Total number of queries executed in the selected period.
- Storage used – Volume of storage currently consumed in the account.
These indicators provide a quick snapshot of overall operational scale and footprint.
Top credit-consuming queries
The Top credit-consuming queries chart highlights individual queries that contribute most to account-level credit usage.
- The chart uses horizontal bars to represent credits consumed per query.
- Query identifiers are shown on the y-axis, with credits on the x-axis.
- Clicking a bar or query ID takes you to the query details page for technical investigation.
Use this panel to surface the most expensive workloads and route them to Data Engineers for remediation.